| Author | Message | ||
Howard Mark (hlmark) Senior Member Username: hlmark Post Number: 337 Registered: 9-2001 |
Don - the 10^-6 figure is approximately (within, say, an order of magnitude) the relative strength of the Raman-scattered signal compared to the intensity of the exciting laser beam, when the sample is a condensed-phase material, e.g., a clear liquid sample. There are, of course, considerable variations at different wavelengths, otherwise the term "Raman spectrum" would be meaningless. That's for "ordinary" Raman. There are some techniques, such as surface-enhanced Raman, that can provide greater signal strengths, but I don't really know too much about them beyond their existence. To be sure, all single-particle scattering is wavelength-dependent. The sky is blue because the blue light, at circa 400 nm is scattered, while the red light at about 750 nm is scattered much less, let's say 2^4 = 16 times less. In the NIR it would be still less; if we go to 1600 nm (= 1.6 micrometers), it's another factor of 16, so that makes it 1/256 of the scattering of blue light. I have no idea, when we look at the sky, what the effective pathlength of air that contributes to the blue light we see, but my guess is that it may somewhere between 10-100 miles, so that's several orders of magnitude more than could be accomplished in the laboratory. I don't know if even the amount of compression you postulate (even if it could be done without turning the water into a liquid) would be enough to overcome all that, but I'm pretty sure that liquid water is considered a "weak" Raman scatterer at best, and other forms of molecular scatter are even weaker. Too bad this is only an NIR discussion group; someone like Fran Adar or Ian Lewis would know, but they don't monitor this forum. I can't say I've ever heard of any Raman spectroscopy being done on gas-phase samples, though. \o/ /_\ | ||
Donald J Dahm (djdahm) Senior Member Username: djdahm Post Number: 55 Registered: 2-2007 |
Howard: I come back from vacation, and I see Vilas has had enough of our �help�. Yes, I know (and knew all along) that quantitatively the suggestion of sample scatter is a source of non-linearity as a stretch here. However, I also added a test (check the baseline to see if it changes with concentration) that should easily determine its significance. As I mentioned to Dave Hopkins on another matter: �I hope no one thinks every one of my postings is a well reasoned conclusion. I recall the normal atmospheric scatter at sea level to have a coefficient of about 10^-5 per meter. I don�t know the units on your 10^-6 number, but I assume it is the scattering cross section in square meters per mole. If one considers the very small dimensions of the molecules, the scattering cross section compared to the molecular dimensions is significant. (If it weren�t significant, the sky would be black.) So if we take a water as a gas as un-see-able in your laser description, and we compress it several thousant times to the density that it has as a liquid, would we expect to see the scatter? My point is that there are other factors besides the scattering cross-section that determines whether scatter is observable visually, and that one of them is distance of separation between scattering bodies compared to the wavelength. Don | ||
Vilas Vyankatrao Jangale (vilasmechgmailcom) Intermediate Member Username: vilasmechgmailcom Post Number: 17 Registered: 5-2010 |
Thank you everyone for your help. This really helped me to get a better understanding of the problem. I will run some more experiments and try to find the cause of this nonlinearity. At this point of time, the PCR/PLS prediction results are within acceptable accuracy (1% error) even with this nonlinearity. So this is not creating any problem for me. Thank you once again. | ||
Howard Mark (hlmark) Senior Member Username: hlmark Post Number: 335 Registered: 9-2001 |
Vilas - the amount of time and effort you spend on this is going to depend on how important it is for you to actually pin down the cause of the nonlinearity in your measurements. This forum can help you with ideas, but in the end, it's going to be your task to troubleshoot your system, and toward that end, you probably need a more organized and systematic approach than can be provided here. If it's important enough, you should take a course in optical instrument design and troubleshooting. If that's overkill than you should at least read a good book on the topic, although I don't know one to recommend offhand. You could do worse than to read Ingle & Crouch's "Spectrochemical Analysis", although you could probably do better, too, since that book is not really oriented toward your needs. Maybe someone on the forum can recommend a better book for you to read up on. Don - it's true that molecules of a gas will scatter, but even with the Raman effect, the amount of scatter is very small, on the order of 10^-6 of the incident light. In the absence of the Raman effect, I doubt that the amount of scatter would be measureable, or even noticeable, in Vilas' experiments. In the absence of particulates to cause scatter, even a strong laser beam is generally not visible in a clear sample such as air. \o/ /_\ | ||
Karl Norris (knnirs) Senior Member Username: knnirs Post Number: 43 Registered: 8-2009 |
To All, I am concerned about the instrument performance in the 1600 to 1700 nm region. When the instrument is set to pass 1650 nm radiation it will also pass a small amount of radiation in the 900 to 1600 nm region. This is stray radiation and may be as high as 1.0%, which means a maximum absorbance reading of 2.0 AU. The stray radiation in the 1200 nm region will be much less, and you can compare the two regions by measuring gas samples having an absorbance of 0.2 to 2.0 AU in the 1200 nm region. The linearity will be much better in the 1200 nm region if stray radiation is the problem in the 1650 nm region. It is possible to greatly reduce the stray radiation in the 1650 nm region by adding a short-wave blocking filter, which blocks radiation below 1600 nm, but passes the radiation in the 1610 to 1700 nm region. Unfortunately, I could not find any information about the stray radiation for your instrument, but I know it will be greatest in the long-wavelength region. The non-linearity from stray radiation can be huge compared to the other effects in the sample. Karl | ||
Donald J Dahm (djdahm) Senior Member Username: djdahm Post Number: 54 Registered: 2-2007 |
Yes, the light lost to the direct line of travel between the source slit and detector is the sum of the loss due to absorption and scatter. Each molecule scatters a little light, the overwhelming majority of which does not reach your detector. The scatter loss shows up as the baseline, which should decrease as wavelength increases. If you see the baseline going up as you increase pressure, that is evidence that you are observing increased scatter as the number of molecules in the path increases. Since the absorbance contribution from both scatter and absorption are proportional to the number of molecules in the sample cell, you don�t need to baseline correct when analyzing the behavior of a pure gas. Base line correction, if done incorrectly, can introduce errors that produce artificial �non-linearity�. The stray light effect from scatter can result if gas in the sample cell is illuminated away from the direct path. These illuminated molecules also scatter, and some of this can reach the detector. This reduces the height of all the peaks, but since we are taking logs, a fixed percentage of "stray light" (compared to the incident intensity) has a ten times greater effect at an absorbance level of 1 than at 0.1. | ||
Vilas Vyankatrao Jangale (vilasmechgmailcom) Intermediate Member Username: vilasmechgmailcom Post Number: 16 Registered: 5-2010 |
If I understood correctly, stray light is unintended light in an optical system. So, I think in this case, scattered light is the main source of stray light. And, during this experiment, I have re-acquired the baseline (or reference intensity, Io) at each pressure. So, the effects, such as, scattering etc. will affect the reference and transmitted intensity in similar way and it should not affect the measured absorbance. So this means that stray light will induce a systematic error in the measurements and will be constant for a given optical system. Can anyone correct me if I am wrong? | ||
Vilas Vyankatrao Jangale (vilasmechgmailcom) Member Username: vilasmechgmailcom Post Number: 15 Registered: 5-2010 |
Hello everyone, Thank you very much for your responses. I think Howard has suggested a simple way to determine the presence and amount of stray light. However, I have only one cell with a fixed pathlength of 30 cm. Is there any other way to determine the amount of stray light? Donald - I do not understand the meaning of "small area detector". I am using a grating spectrometer, which has a linear diode InGaAs array of 128 elements, detectivity in the range 900 to 1700 nm. If you would like to know the specifications of the spectrometer, please follow the URL https://docs.google.com/viewer?url=http://www.controldevelopment.com/pdfs/NIR_Spec_Sheet.pdf. (the detector is NIR128L-1.7T1) Howard - In one of your earlier responses, you mentioned that "for good linearity, the instrumental bandwidth should be small compared to the narrowest absorbance band to be measured". If I understood correctly, the instrumental bandwidth is the FWHM of the instrumental profile and the bandwidth of an absorption band will be the FWHM of the natural broadening at peak wavelenth in a given band. Thank you, Vilas | ||
Howard Mark (hlmark) Senior Member Username: hlmark Post Number: 334 Registered: 9-2001 |
It occurs to me that if Vilas has the capability to measure his gas samples in cells of different pathlength, he should be able to get a direct measure of his stray light. All he has to do is to measure the absorbance at some of his absorbance peaks, and at the same set of pressures for the various different pathlengths, then extrapolate the data back to zero pathlength. An absorbance at zero pathlength, at any given wavelength, that is non-zero by more than the variation allowed from experimental error, will indicate the presence, and the amount, of stray light. For accuracy, he should include cells with the shortest pathlengths that can give an accurate readings of absorbance, at some key wavelengths. Also, cell positioning should be such that any light reflected from the cell should be the same, for the different cells; this may be part of the stray, if it gets into the optical path. \o/ /_\ | ||
Karl Norris (knnirs) Senior Member Username: knnirs Post Number: 42 Registered: 8-2009 |
To Dave, Did you notice that I wrote "guess". I don't know the instrument, but I guessed that the stray radiation would be a minimum in the 1000 nm region, and I chose a number of 0.1%. I made the number larger at shorter and longer wavelengths going to 1.0% at 1700 nm. I chose 1.0% at 1700, because it appears the absorbance of the sample is peaking at about 1.8 AU, which is what will happen if the stray radiation exceeds 1.0%. I suggest a simple experiment. Vilas should measure the same samples with a pathlength of 50 cm, and observe the linearity in the 1200 nm region. My guess is that the linearity will be much better than in the 1650 nm region with the 30 cm path. The other option is to use larger concentrations to obtain readings as high as 1.8 AU in the 1200 nm region. This experiment will demonstrate the difference in stray radiation as a function of wavelength. Karl | ||
Howard Mark (hlmark) Senior Member Username: hlmark Post Number: 333 Registered: 9-2001 |
Carbon black is the "blackest" physical material that we know of, as far as I'm aware. Maybe Art can give better figures, but as far as I know, the blackest carbon blacks reflect about 0.5-1% of the light incident on them. There is, however, something that is even "blacker" than that. Given that the meaning of "black" is that light goes in and nothing comes out, a hole, properly set up with nothing behind it that can reflect any light, can be even "blacker" than carbon black. It's a tricky and difficult thing to achieve, but there are commercial companies that manufacture "blackbodies". Usually those are also temperature-controlled so that they can be used to create a good approximation to the theoretical Blackbody Distribution of light, but for the current purposes I don't think that capability is needed. Howard \o/ /_\ | ||
David W. Hopkins (dhopkins) Senior Member Username: dhopkins Post Number: 154 Registered: 10-2002 |
Hi Vilas, I couldn't agree more with Don. I take the Wikipedia article to be declaring somebody's experience, that absorbance range is way too narrow for many of today's instruments with large detectors designed to collect more than undeviated light from non-scattering samples. For everyone's benefit, I wonder if you could explain to us how you derived the curve you present, Karl. I think you could attempt to measure your stray light, Vilas. It's not easy, or fun. You need to measure a completely absorbing sample, and it should be like the sample cell you are using. You could try filling a second sample cell with carbon black powder. That is a messy business. The aim is to have the sample infinitely absorbing, so that light getting to the detector in all other pathways in the instrument is measured. That includes light that is reflected of the front surface of the cell and reflected back along the sides of the cell, and all other paths. Does anyone have a suggestion of other samples that can be used in Vilas' instrument for this purpose? I have used the method described for spectrophotometers designed for diffusely scattering samples with success, but the sample cell was packed once, and kept for that purpose, because working with carbon black is no fun. Best regards, Dave | ||
Donald J Dahm (djdahm) Senior Member Username: djdahm Post Number: 53 Registered: 2-2007 |
As long as we are suggesting our own favorite efects that may be in play here: I assume you are using a small area detector. As you increase the pressure (density/concentration), the amount of scatter increases. Multiple scatter then can become a source of "stray light". (The scatter effect shows up differently with hemispherical detection.) As far as Wikipedia saying "the law is applicable when the absorbance is in the range 0.1 to 1 absorbance units (AU)" goes, if we take that as a caution that relatively minute effects can begin to be important as the amount of light reaching the detector becomes small, it is fine. If, however, we take it as a statement that has a theoretical underpinning, it's a bunch of "hooey". | ||
Karl Norris (knnirs) Senior Member Username: knnirs Post Number: 41 Registered: 8-2009 |
Vilas, I suggest you are measuring stray radiation at long wavelengths. I am guessing your stray radiation may look like the attached image. Correcting for the stray radiation will change your spectra to be closer to the truth. Karl 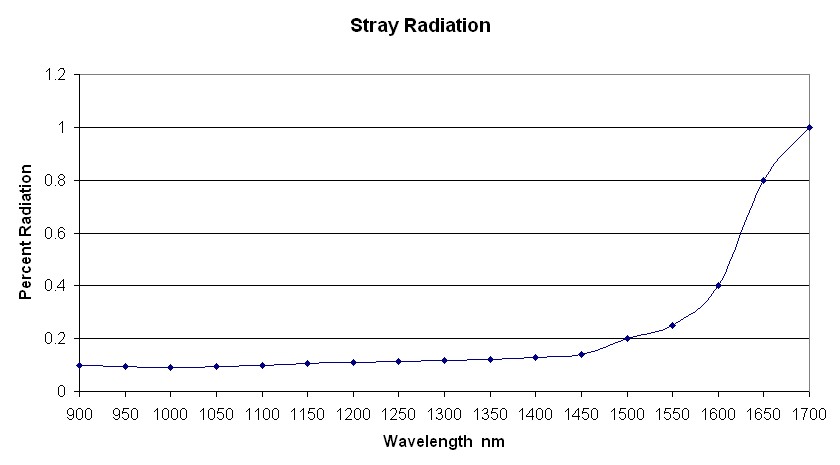 | ||
Howard Mark (hlmark) Senior Member Username: hlmark Post Number: 332 Registered: 9-2001 |
Bruce - an "infinitely narrow" beam is an idealization, along with a "perfectly collimated" beam or a "point source". None of these can exist in the real world, as can be proven by thermodynamics. Nevertheless your point is valid. For good linearity, the instrumental bandwidth should be "small" compared to the narrowest absorbance band to be measured. That's definitely one of the instrumental characteristics that needs to be checked. Most of these need actual measurements of the hardware, to be certain you've detected the correct cause and not some surrogate. Few of them can be detected by post facto calculations from the final spectra, although stray light is one such. \o/ /_\ | ||
Howard Mark (hlmark) Senior Member Username: hlmark Post Number: 331 Registered: 9-2001 |
Vilas - you've confirmed what I only could suspect: that the broadening cannot be detected by direct measurement. However, that does not mean that it is not happenning, or that it is not "robbing" molecules that would otherwise contribute to the peak absorption. I don't want to get too enamored of my own hypothesis (guess) but considering that as a cause of the decrease in absorption is not ruled out. Niether are instrumental or other experimental effects. One point that is easily checked (computationally, if not experimentally) is to determine the equivalent of how much stray light you would have to remove from the measured data to linearize, for example, the band at ~1700. If you cannot linearize the data that way, that pretty well rules that out as the cause. If it does, you could also repeat that for the other peaks, to see if that same correction linearizes them, also. This does not necessarily mean that it is actually stray light that is affecting your readings, you would have to make actual optical measurements to confirm that. This procedure will, however, give you an estimate of the relative magnitude of the effect that you are looking for. Howard \o/ /_\ | ||
Bruce H. Campbell (campclan) Moderator Username: campclan Post Number: 123 Registered: 4-2001 |
Vilas, Beer's Law is most linear when the wavelength spread of the exciting beam is infinitely small. This appears to be some of your problem. Bruce | ||
Vilas Vyankatrao Jangale (vilasmechgmailcom) Member Username: vilasmechgmailcom Post Number: 14 Registered: 5-2010 |
To be clearer, for hydrogen, the increase in FWHM due to pressure/temeprature broadening is close to 0.01 nm at 1 micron at standard pressure and temperature. This broadening is nothing compared to the instrumental profile half-width. | ||
Vilas Vyankatrao Jangale (vilasmechgmailcom) Member Username: vilasmechgmailcom Post Number: 13 Registered: 5-2010 |
Hello Howard, Thank you for your response. In this case, the impact pressure or collisional broadening is negligible compared to the instrumental profile width. For example, I did some calculations for hydrogen. For hydrogen, at a wavelength of 1 micron, the FWHM is 0.01 nm, which is negligible compared to 12.5 nm (instrumental profile FWHM). Similarly, the thermal doppler broadened widths are negligible. Thus, I am sure that this non-linearity is not due to this broadening effect. Somehow, I feel that one of the possible reasons is that Beer's law is applicable when A=0.1 to 1 (reference: wikipedia). | ||
Howard Mark (hlmark) Senior Member Username: hlmark Post Number: 330 Registered: 9-2001 |
Vilas - I was under a misapprehension about how the experiment was done, and I think at least some of the other responders were, also. I thought you were changing the partial pressure of the analyte gas while maintaining a constant total pressure. Now I realize that you were changing the total pressure of the analyte gas. This makes a big difference, especially when you compare the results with liquids. In a liquid, there are always interactions between the various molecules comprising the sample. The interactions may change if you mix the liquid with a different liquid, which may affect the spectrum of both materials, but for a given pure liquid, the spectrum is pretty constant (ignoring instrumental effects, including temperature, as were mentioned previously). In a gas, the behavior changes as the pressure changes. The reason is that for a gas at low pressure, the molecules of the gas are nearly independent of each other because they collide infrequently; therefore their spectra are determined only by the usual quantum rules. As the pressure of the gas is increased, collisions become more frequent. A collision constitutes an interaction that changes the energy levels of the molecule, and thus the wavelength it absorbs at; the higher the pressure, the more molecules are affected in a given time interval, and the more the energy level are changed. The net result is that fewer molecules absorb at the "peak" wavelength corresponding to a given transition, and more molecules absorb at nearby wavelengths, reflecting the distortions of the energy levels. The phenomenon is called, appropriately enough, "collision broadening". I have some nice spectra showing this effect in (gaseous) methane, where the actual broadening can be seen. In your spectra, the bands are already so broad that it may be difficult to see the extra broadening from this effect, although you might try to determine if you can detect it. If it's observable at all, this broadening can be seen near the baseline of the absorption band as well, or perhaps even better, than at the half-height point. The broadening is inevitably accompanied by a decrease in the relative height of the peak, since the molecules that are absorbing at the extremes of the band are the ones that are missing from the center, so it may well be that this is the cause of the non-linearity you are reporting. However, before you can conclude that this is the effect, it is important for you to demonstrate that the cause is not one of the various experimental possibilities that were mentioned. Howard \o/ /_\ | ||
Vilas Vyankatrao Jangale (vilasmechgmailcom) Member Username: vilasmechgmailcom Post Number: 12 Registered: 5-2010 |
Thank you all for the responses. Donald - Yes, you are right. When I plot {log(1/T)} of a sample of pure gas against {density/concentration} of that gas, the plot becomes slightly non-linear above 1 absorbance unit (AU). I am using the units of moles per unit volume. For example, please take a look at the attached document, which shows the NIR absorption spectra of propane (in the pressure range 14.4 psia to 119 psia with step of 25 psi). These spectra are for pure propane in 30 cm path length and with a spectrometer having an instrumental profile width of 12.5 nm FWHM. We can see that for the first two (starting from lower wavelength, 900 nm) overtones, the absorbance increases almost linearly with density. However, in the third overtone near 1700 nm, we can see some non-linearity at the peak. I could perfectly fit a second order polynomial to the abosorbances at 1660 nm. One of the possible reason for this non-linearity can be sensitivity/inaccuracy of the instrument near its boundaries. The instrument works in the range 900 to 1705 nm, has 128 elements (linear dispersion 6.25 nm/pixel). Also, I am using the common base (10) for calculating the absorbance of gases. Please help me in understanding the possible true reasons behind this. Thank you, Vilas  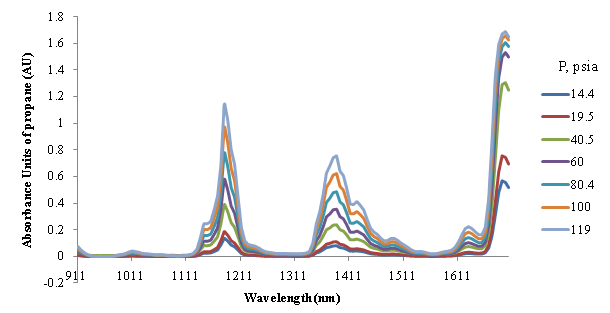 | ||
Hector Casal (casalh) Junior Member Username: casalh Post Number: 7 Registered: 1-2007 |
One of the significant sources of non-linearity in the case of gas phase spectra has to do with the instrument line shape function. The relation between the width of the signals measured and the resolution must be taken into account. The observed spectrum is a convolution of the ILS and the real response. Don Ramsay wrote the fundamentals (J Am Chem Soc, 1952, vol 74, page72). The same issues have been discussed A LOT since then, see for example Anderson and Griffiths (Anal Chem vol 47, page 2339 (1975)). | ||
Howard Mark (hlmark) Senior Member Username: hlmark Post Number: 329 Registered: 9-2001 |
Vilas - I'd say Don has nailed the point. The probability is overwhelming that the answer to your question is in the experimental aspects. Don't forget that when discussing high absorbance, you're really talking about very low signal levels. 2 absorbance means that the sample is allowing only 1% of the light to pass through, 3 absorbance means that only 0.1% passes through the sample, and so forth. At these low signals, it doesn't take much of an imperfection or non-ideality in the optics, electronics (including the detector), mechanics, chemistry or any other part of the system or the instrument to affect the readings. Howard \o/ /_\ | ||
Donald J Dahm (djdahm) Senior Member Username: djdahm Post Number: 52 Registered: 2-2007 |
Before jumping in with the host of experimental factors that can cause non-linearity, we should know for sure what you are saying. Are you saying that when you plot the { log(1/T) } of a sample of a pure gas against { density/concentration } of that gas, the plots become sub-linear above 1 absorbance unit? What units are you using for concentration, e.g. { g/L }? | ||
Vilas Vyankatrao Jangale (vilasmechgmailcom) Member Username: vilasmechgmailcom Post Number: 11 Registered: 5-2010 |
Hello everyone, I am trying to characterize natural gas mixtures which contain primarily methane, ethane, propane, butane and carbon dioxide using NIR spectroscopy. I process the NIR spectra of these gases using chemometric methods such as PCR/PLS and Beer's law. Now, as we all know, Beer's law has some limitations for its applicability. For example, the most important limitation is that it is applicable only to optically thin media. I referred to Wikipedia and it says that the law is applicable when the absorbance is in the range 0.1 to 1 absorbance units (AU). When I experimentally studied the variation of the absorbance with density of the mentioned gases, I came to a conclusion that when the absorbance is greater than approximately 1 unit, the linearity in absorbance with density/concentration is no more valid. For example, in the hydrocarbon overtones near 1700 nm, we can easily see this non-linearity. However, I also heard from some of my friends that this linearity in absorbance with concentration is also found in the case of some liquids, even if absorbance is far greater than 1. Please help me in understanding this problem. |