| Author | Message | ||||
Karl Norris (knnirs) Senior Member Username: knnirs Post Number: 82 Registered: 8-2009 |
To All, I have many posts and many images on this subject, so I will make a brief summary. The NIR milk coagulation spectra can be explained in very simple terms. The changes in spectra with time were caused by the accumulation of thin layers of film producing a change in reflection having a slope such that the greatest reflection was at the shortest wavelength. Unfortunately the instrument did not have adequate performance and the errors in both the transmission and reflection spectra made these simple changes difficult to observe. There was no change in optical pathlength so the changes were not caused by scatter. | ||||
Karl Norris (knnirs) Senior Member Username: knnirs Post Number: 80 Registered: 8-2009 |
My story, I hope those who follow this discussion are aware that Don and I have been coworkers and good friends for a long time. I think we make a good combination with Don focusing on the theory and I focus on the experimental data. We don't allways agree and we don't hesitate to say so. In a recent post I stated that "the reflection data are not really from the sample, but are caused by instrument non-linearity." What I should have stated is that the instrument non-linearity was affecting the shape of the absorption bands of the sample. When the reflection of a sample is measured with a fiber probe it is important to know that the fiber bundle is not in direct contact with the sample, because there is a window on the probe to protect the fibers.This window typically has a reflection of about 2.0 %. This reflection is going to change depending on the refractive index of the sample in contact with the window. As a result of this reflection such probes seldom show a Log(1/R) value greater than 2.0. If we look at the Log(1/R) of our sample in the 5000 wavenumber region (my post 75) we observe a flat line just slightly larger tha 2.0. This is the instrument effect, because the signal in this region should be at least 3 times larger than the signal in the 6900 region. Now we don't know the magnitude of this effect in the 6900 region, but it is there. I am hoping Don or someone else will show us how to correct our data to remove this error. I looked at the difference spectra in transmission in my post #74 and in reflection post #76 and decided I could make them more similar by modifying the reflection data. I am going to do this by replacing the data for each spectrum in the 7100 to 6000 wavenumbers with a sloping straight line. The attached image shows my modifications to the reflection difference spectra. Now I add the spectrum of the milk sample to each difference spectra to reconstruct the reflection spectra with a correction for the non-linearity. My new reflection spectra and the original spectra are plotted in the second image with an offset of -0.4 applied to the original data. I have done this data manipulaion on every fifth sample of the set of 80 samples to demonstrate the idea. Now a close examination of the spectra shows that nost of the flattening of the water band has been removed, and now I state that it appears we are not observing an effect of change in numbers or size of particles as the a function of time. It appears to me that we are observing a change in the thickness of a layer that has a reflection which reduces slightly gong from long to short wavenumbers. This observation fits both the transmission data and the corrected reflection data. I have also added an image showing the 4thDerivative of the corrected spectra. This has been converted to wavelengths, and shows the water bands at 1151 nm, 1410 nm, and 1790 nm. I must make my images a bit smaller for this Forum 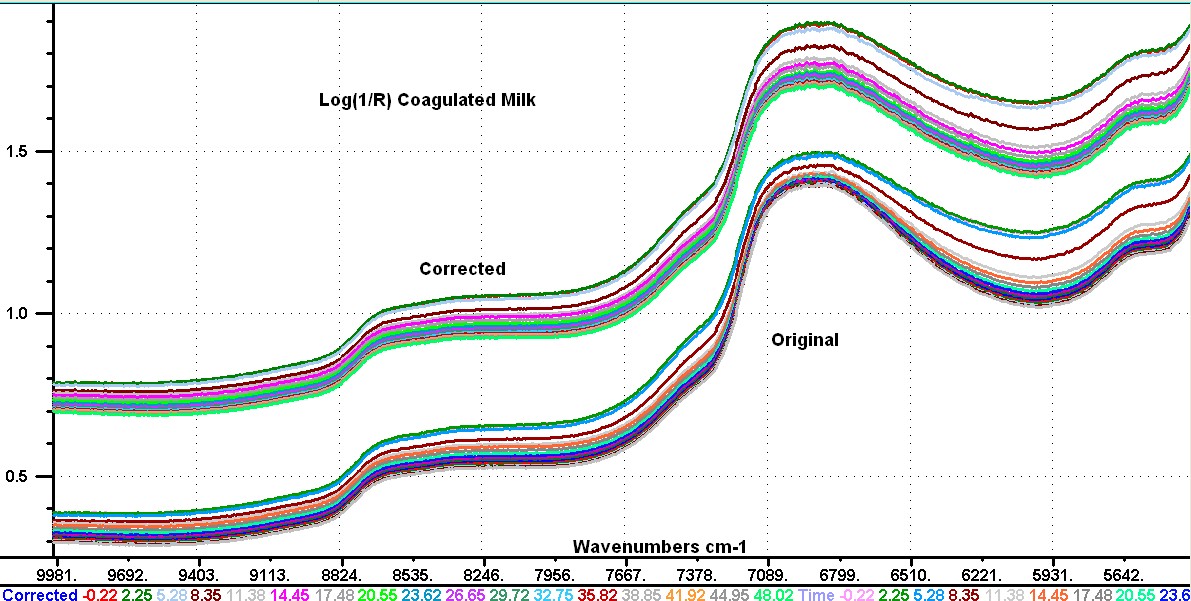 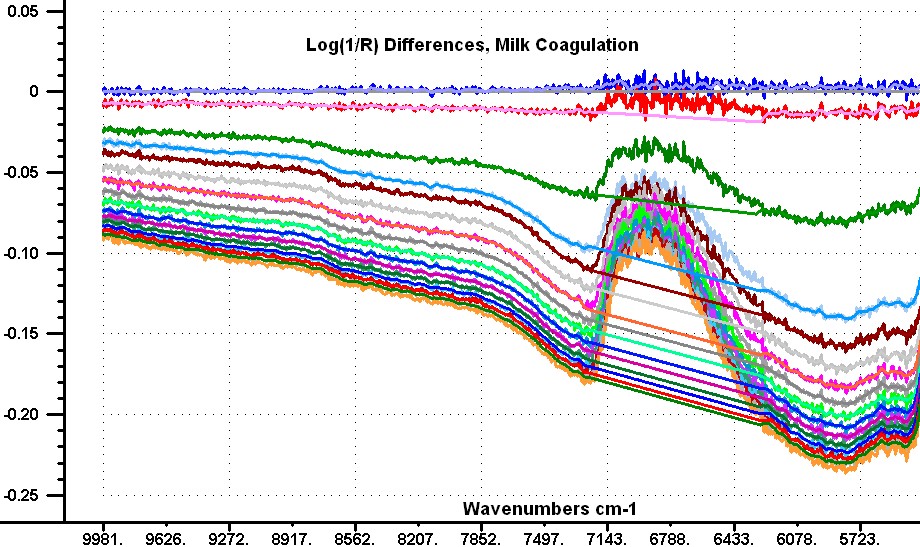 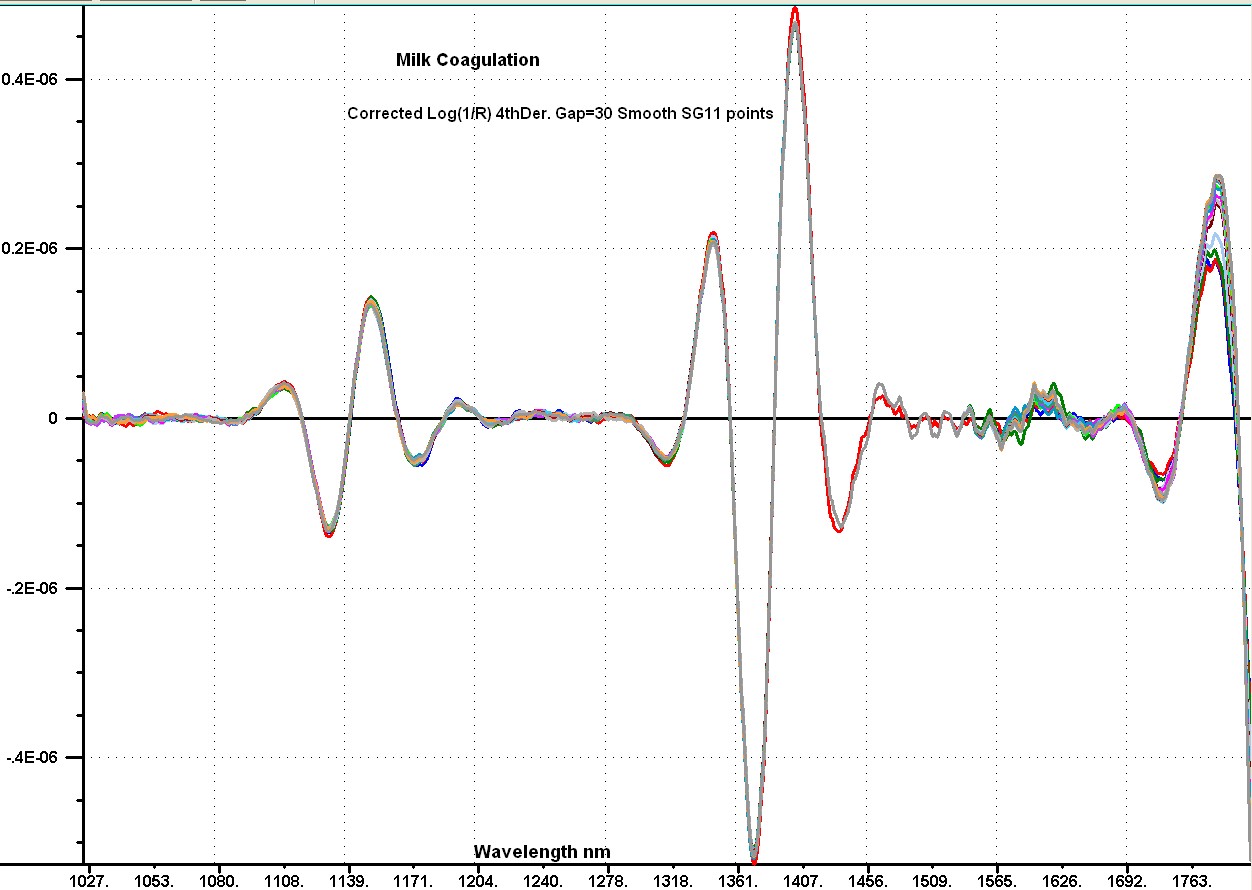 | ||||
Donald J Dahm (djdahm) Senior Member Username: djdahm Post Number: 92 Registered: 2-2007 |
Hey, Tony! You said: If we assume that these casein micelles are spheres and that only aggregation is taking place (i.e. no new material is being precipitated). Then there will be no volume change so we can easily calculate how many small micelles (radius 50nm) will have to aggregate to form micelles of radius 500nm. The answer is 1000. Now we know the size and number of spheres we can calculate the change in surface area. The answer is that it will be 10% of the original surface area. Here�s the way I look at it. When we make a particle with 10 times the diameter as before, we have 1 layer of particles where we had 10 layers before. The total suface area has changed by a factor of 10, as you say, but the surface area of the particles in a single layer remains unchanged. The chance of a photon going through a layer without hitting a particle remains unchanged. We have 0.1 times as many layers but each one is 10 times as thick, so the �clear path length� through the water remains unchanged. So the �direct transmission� through water is unchanged. If we are observing multiple scatter, then the diffuse pathlength though the sample of larger particles goes down compared to the smaller particles, because of a decrease in total scatter (or the number of layers). | ||||
Christian Hansen (chha) Senior Member Username: chha Post Number: 28 Registered: 6-2010 |
Hello Quote T. Davis: "PS Just saw something about particle size and numbers from Christian but then lost it!! This thread is getting very long." Post 23 and 24 describe some aspects of particle size changes during milk coagulation as well as some observations on the effect of particle size (not particle concentration) on spectral slope in NIR. Best, Christian | ||||
Tony Davies (td) Moderator Username: td Post Number: 307 Registered: 1-2001 |
Hello Forum! This must be one of our most long running and extensive discussions! I may have missed it (there is a lot to go through now) but I do not think that anyone has been interested in the physics (and possibly chemistry) of the problem. I have never studied milk systems, so I do not have any specialist knowledge; so this is based on what Christian told us at the beginning: Posted on [Tuesday, June 08, 2010 - 7:14 am:] **************************************************************************** �My question is what kind of scattering is going on? Is it Rayleigh or Mie-Lorentz? The size of casein micelles in milk is 100-500 nm. During coagulation the micelles start to aggregate and thus become up to ten times bigger, where after they form strands and a network. Can anybody explain how these size changes affect the scattering physics? ********************************************************* If we assume that these casein micelles are spheres and that only aggregation is taking place (i.e. no new material is being precipitated). Then there will be no volume change so we can easily calculate how many small micelles (radius 50nm) will have to aggregate to form micelles of radius 500nm. The answer is 1000. Now we know the size and number of spheres we can calculate the change in surface area. The answer is that it will be 10% of the original surface area. These are quite large changes but I�m not at all sure what effect we should expect them to have on scattering and absorption. IF we can assume that the scattering of the large micelles is similar to that of the original small micelles (although we are getting close to the boundary for Raleigh scattering with the large ones) then a 90% reduction in surface area should produce a significant effect in reducing scattering. I have even more difficulty in trying to visualise the effect of particle numbers. I like to start with Gerald Birth�s famous pictures of the effect of milk in a water tank illuminated by a laser beam. When there are few particles path length is large, when there are many particles path length is small. But what happens when a large number of small particles become a small number of large particles? My guess is that quite large gaps will have opened up between particles so path lengths will be longer and absorption (in the aqueous phase ) should increase. Perhaps I should add that I think the micelle phase is about 20% and after about 15 minutes chemistry begins to take over and the continuous gel starts to form. Best wishes, Tony PS Just saw something about particle size and numbers from Christian but then lost it!! This thread is getting very long. | ||||
Tony Davies (td) Moderator Username: td Post Number: 306 Registered: 1-2001 |
Karl, I can see 1 and a half spectra. Is that what you sent? Tony | ||||
Donald J Dahm (djdahm) Senior Member Username: djdahm Post Number: 91 Registered: 2-2007 |
In the attached, I have tried to carry out Karl's command to "explain the theory". I also take exception to his last post.
| ||||
Karl Norris (knnirs) Senior Member Username: knnirs Post Number: 79 Registered: 8-2009 |
Back again, I now wish to offer an explanation for the image I presented in my post #76 for the change in time for the reflection data, which did not match the transmission data. I suggest the absorption bands we see in the reflection data are not really from the sample, but are caused by instrument non-linearity. Someone noted earlier that the water bands showed an apparent saturation effect in the Log(1/R) at a value as low as 2.0. If we could remove or correct for this non-linearity I predict the difference spectra from the reflection spectra would be similar to those for the transmission spectra. Karl | ||||
Karl Norris (knnirs) Senior Member Username: knnirs Post Number: 78 Registered: 8-2009 |
Tony, Ian implied there was no limit to the number of messages, but no single message can be larger than 200k. I tested the 200k limit by trying an image with 200.1k which was rejected. The new image is 171k, and I will see in a moment if that works. It works, and note on my computer the images are up and down, not side by side as you suggested. Please note that my copy scheme did not allow me to include the full image. It seems I need a response from others about what they see. 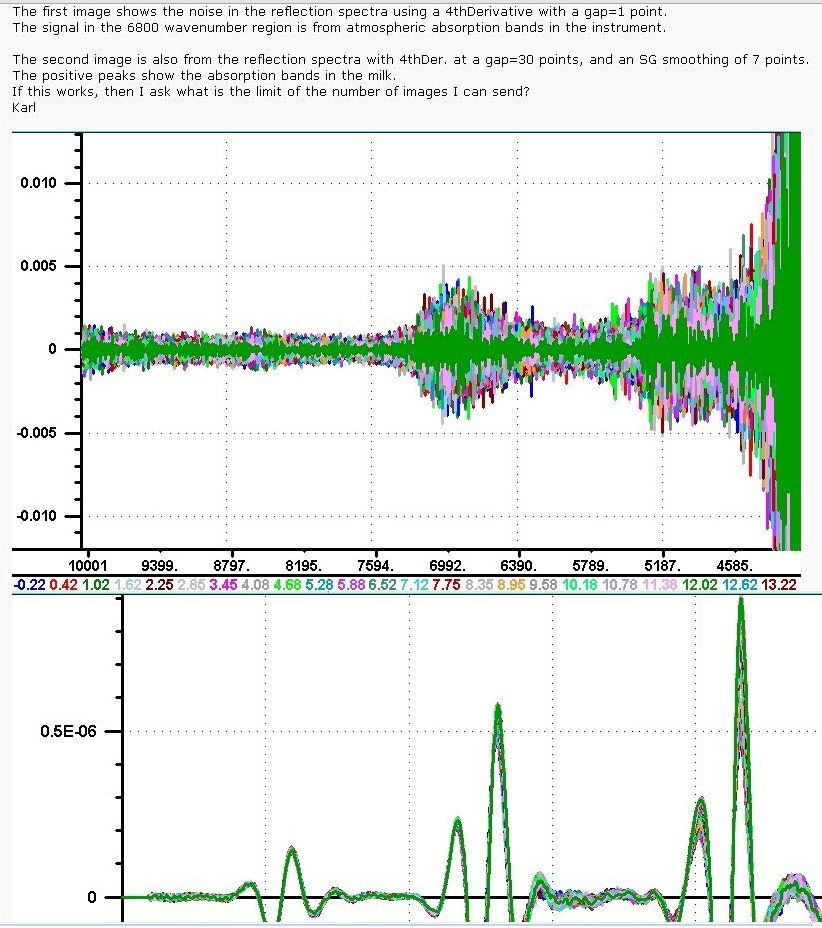 | ||||
Tony Davies (td) Moderator Username: td Post Number: 305 Registered: 1-2001 |
"If this works, then I ask what is the limit of the number of images I can send? Karl" Hello Karl, I would ask Ian but he caught flu' at PitCon (or more likely on the plane). I think there could be a problem because they have come up left to right rather than one below the other. Do you want to try 3 and see what happens? Best wishes, Tony | ||||
Karl Norris (knnirs) Senior Member Username: knnirs Post Number: 77 Registered: 8-2009 |
Hello, I am trying to post two different images. The first image shows the noise in the reflection spectra using a 4thDerivative with a gap=1 point. The signal in the 6800 wavenumber region is from atmospheric absorption bands in the instrument. The second image is also from the reflection spectra with 4thDer. at a gap=30 points, and an SG smoothing of 7 points. The positive peaks show the absorption bands in the milk. If this works, then I ask what is the limit of the number of images I can send? Karl 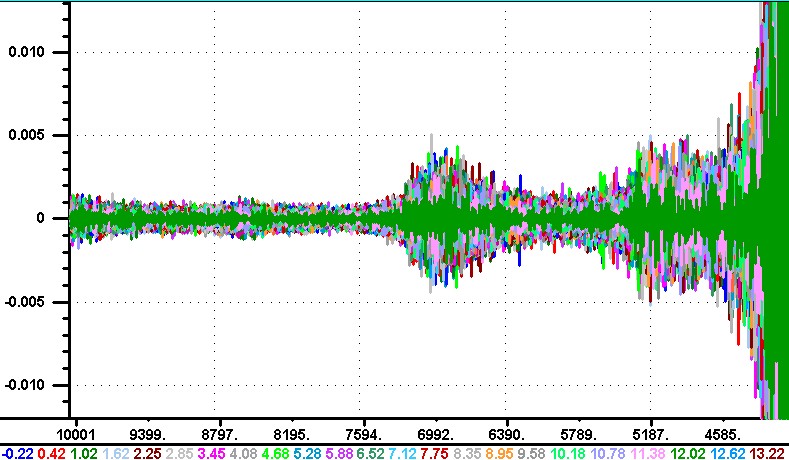 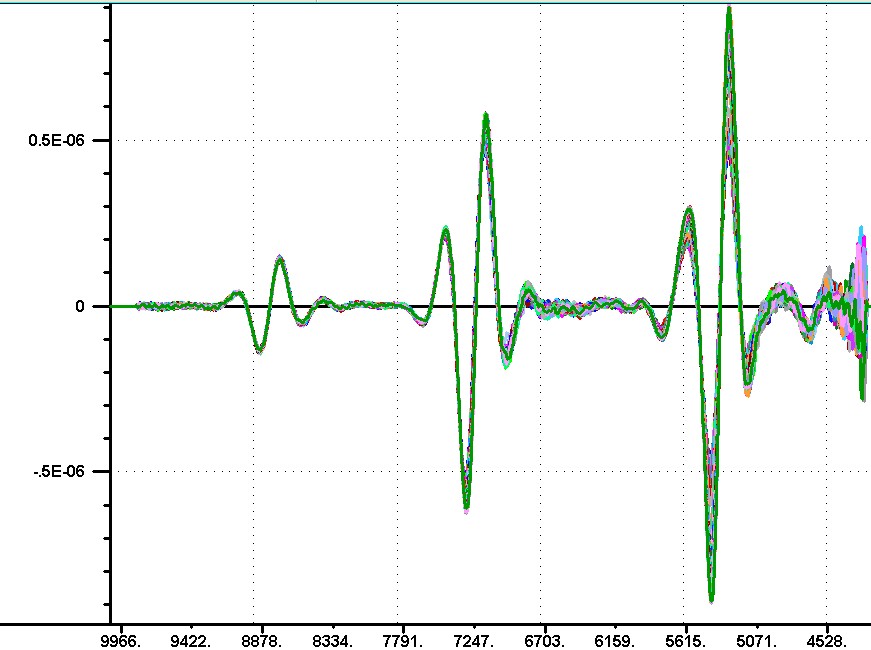 | ||||
Karl Norris (knnirs) Senior Member Username: knnirs Post Number: 76 Registered: 8-2009 |
Back again, I am attaching the image of the Log(1/R) differences in time to match the Log(1/T) spectra provided earlier. These are using the same time differences, but please note the absorbance change is in the oposite direction. In addition the change in absorbance is many times smaller in the reflection spectra. I will let Don explain the theory, but I believe I could reproduce the transmission data by starting with the milk and adding thin layers of teflon of increasing thickness. The teflon would increase the surface reflection without changing the milk spectrum.The increase in surface reflection will be recorded as a decrease in transmittance without changing the milk spectrum. Now if my teflon had a slightly higher reflectance at high wavenumbers compared to the low wavenumbers this would cause the slope we are seeing as time progresses. So I am suggesting we are observing a layer effect rather than a particle effect in the transmission spectra. Now for my explanation to be valid the coagulation material needs to have reflectance properties like my teflon,that is a reflectance that decreases slightly as we go from 10,000 wavenumbers to 4000 wavenumbers. Now the current image does show that the reflectance is increasing with time because the Log(1/R) at any wavlength is decreasing with time. Howevere, now the change in reflection is mixed with the reflection properties of the milk to produce the spectral differences in this image. This is my current explanation. I will later add some additional information about these spectra. Karl 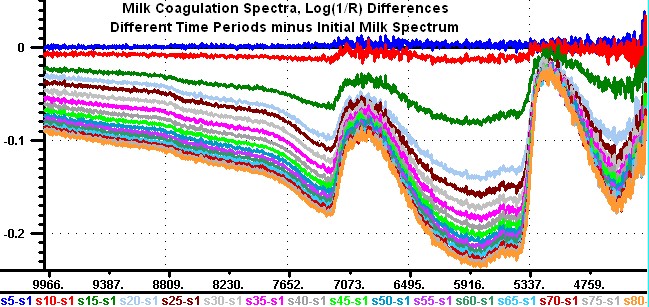 | ||||
Donald J Dahm (djdahm) Senior Member Username: djdahm Post Number: 90 Registered: 2-2007 |
OK, Karl: I understand the game. I will respond with my "explanation" before you give your "story", but I think a few others should chime in. (See I can be coy, too. But not for long.) While they are at it, they can say if they buy my explanation of what I found surprising; more scatter for larger particle size. That blew my mind when I first saw it in Tiziana's data. T.M.P. Cattaneao et al; JNIRS 17, 337-343 (2009). [There are probably several young people shaking their heads in wonderment at how little it takes to thrill us.] Don | ||||
Karl Norris (knnirs) Senior Member Username: knnirs Post Number: 75 Registered: 8-2009 |
Don, What I found surprising was the fact that the water band in the 6900 region was missing. This means that there was no change in pathlength in spite of the big change in radiation level in all regions of the spectra. I am attaching an image of the Log(1/R)and Log(1/T) for the different time periods from 0 to 48 as noted in the bottom line. Please note that the the reflection spectra show non-linearity in the 6900 and in the 5200 to 4000 regions. I need to show another image before offering my story on these amazing spectra. This Discussion Forum is not ideal for showing spectra as I am forcing it to do. Karl  | ||||
Donald J Dahm (djdahm) Senior Member Username: djdahm Post Number: 89 Registered: 2-2007 |
Karl: The last time you "coyly" invited me to interpret a set of spectra, I wound up giving a theoretical interpretation to what you then demonstrated were instrumental effects. I assume that what you find "surprising" is the fact that the scatter loss in transmission is increasing as particle size gets bigger. I don't think that is what is happening. I think that if you had data a lower wavelengths (like down in the visible) the small particle sizes would be higher than the larger ones. I think that what you are seeing is a particle size dependent trend in the falloff in scatter as a function of wavelength. The larger the particle size, the higher the wavelength before the falloff begins. I did some calculations and prepared some figures related to this for the upcoming JNIRS Special Issue on Milk. (The article hasn't ben accepted as of yet.) I will upload the Figures. Coincidently, at least five people have asked me if I was going to be at the conference in France because they wanted to discuss this very subject. Maybe a Special Poster session on Scattering in Milk is in order. In any case I also would be interested in having a discussion here.
| ||||
Karl Norris (knnirs) Senior Member Username: knnirs Post Number: 74 Registered: 8-2009 |
Hello, I wish to reopen a discussion of NIR and Milk Coagulation. The last entry was 7/3/2101, and I don't believe we did an adequate job of describing the spectra. Through the kindness of Christian Hansen I now have the raw spectrum from his experiments where he collected 81 spectra in reflection and transmission of milk as it went through the coagulation process. He repeated the experiment 12 times so I now have 972 log(1/T) and Log(1/R)spectra covering the wavenumber region from 10,000 to 4,000. The data we have seen in the past were a transformation to wavelength of spectra from one of these 12 experiments. I am attaching transmission difference spectra from one of these 12 experiments. I am going to be coy and not give you my interpretation of these surprising results. You can see the instrument noise increasing with time in the 10,000 region, and complete loss of signal in the 5000 region, as well at below the 4300 wavenumber region. But please note that there is no water band in the 6900 wavenumber region in any of the difference spectra. The bottom line in my chart shows the identification of the individual spectra, (s5-s1) means record number 5 minus record number 1 in blue. However, this curve is hidden by the s10-s1 in red. Karl  | ||||
Donald J Dahm (djdahm) Senior Member Username: djdahm Post Number: 51 Registered: 2-2007 |
CHRISTIAN: In your June 22 post, you said: �In comparing NIR transmission and reflectance spectra of the coagulating milk I noticed that changes occur earlier in the reflectance spectra than the transmission spectra. Is that to be expected and why is that?� Without addressing your spectra specifically (for which things are a bit more complicated because there is �Pseudo-Absorption� due to the �escape� of light), one expects the response to scatter increases to be different in remission from transmission. For starters, all the light observed in remission is scattered, while only a portion of the light observed in transmission is. Quantitatively, the gross approximation answer is that the Absorbance in the directly transmitted beam is proportional to scatter (at zero absorption), while the A(R,T) function is inversely proportional to the backscatter (at low levels of scatter and absorption). However, things are more complicated than that. Suppose you have an infinitely thick sample made up of layers each of which backscatters 5% of the light incident on the layer. Now suppose we increase the scatter to 10% in each layer (without changing absorption, which we will assume is low). To a first approximation the A(R,T) function goes down and is about half what it is before. As the scatter increases more and more, there is less and less effect observed, because the function goes by 1, �, 1/3, �, etc times the 5%. When there is intensity loss, and �a� is not zero, and the response function { A(R,T) = (2-a-r) a/r } has several factors in it, some causing an increase with scatter; some causing a decrease. Now suppose you have transmission through a fixed path length which contains one layer, which scatters 10% (5% back, 5% forward). All that light misses a small area detector, and gives rise to an observed absorbance of about 0.05 (in the absence of absorption). Now if we double the scatter to 20%, we double the log(1/T). This trend continues undiminished in the directly transmitted light, but some of the scattered (diffusely transmitted) light finds its way to the detector, causing the function to become sub-linear. Don | ||||
Donald J Dahm (djdahm) Senior Member Username: djdahm Post Number: 50 Registered: 2-2007 |
Here are two spectra of oil in water emulsions where the larger droplets exhibit a smaller slope.
| ||||
Donald J Dahm (djdahm) Senior Member Username: djdahm Post Number: 49 Registered: 2-2007 |
Christian: You said: I guess that I cannot actually do the �log(R+T) trick using my spectra, because the milk being measured with the reflectance probe has infinite thickness. Or what?? Well, I think we now know why the correction did not work as well at the early stages as later. The transmission data is at a finite thickness, while the remission data is for �infinite thickness�. Thus as the scatter increases, the correction gets better as the transmission sample gets closer to �infinite thickness�. (Except, of course it can�t correct for the loss of intensity due to the scatter loss mentioned in the previous post; because that light is lost to both detectors.) Go ahead and use the trick. Remember that the functions log(1/T) and log(1/R) are not proper theoretical functions either. (THERE�S NO BEER�S LAW FOR SCATTERING SAMPLES.) | ||||
Donald J Dahm (djdahm) Senior Member Username: djdahm Post Number: 48 Registered: 2-2007 |
After looking at the sketches of the experimental arrangement, I am assuming that much of the scattered light is escaping out into the sample, and is being lost to the transmission detector. The more scatter, the more loss, the greater the baseline increase. Thus I�m hypothesizing that the change in baseline is not due to a change in pathlength. Furthermore, the direct transmission goes down as scatter increases, and so the absorption peaks decrease in size. In remission, only the light that is scattered gives rise to the signal, so the absorption peaks actually increase in size as scatter (and pathlength) increase. | ||||
Karl Norris (knnirs) Senior Member Username: knnirs Post Number: 40 Registered: 8-2009 |
Christian, I have been trying to understand the change in the transmission spectra over time. I have been assuming that the amount of liquid in the sample was constant at 1 mm, but in fact that is not true. As the coagulation progresses the measured sample contains more solid material and less liquid. It may be a coincidence that the change in scatter is increasing the pathlength, and decreasing the amount of liquid such that the absorption band of water remains constant. I like this speculation better than my previous. Karl | ||||
Christian Hansen (chha) Advanced Member Username: chha Post Number: 24 Registered: 6-2010 |
A summary of the discussion so far: The log(1/T) plots show a downward slope, consistent with a decrease in scatter with wavelength. There is also an increase in absorbance with coagulation time, consistent with an increase in scatter. Since the general slope in a log(1/R) plot frequently tracts particle size, there was a request for a plot of the MSC coefficients for the data. The data apparently shows a decrease in particle size (increase in �slope�) very early in the process as particles in the milk become smaller. Previous research using Dynamic Light Scatter have also observed a decrease in average micelle size in the initial minutes of rennet coagulation attributing it to proteolytic removal of the hairy layer (k-casein) surrounding casein micelles. This is followed by a rapid increase in particle size (decrease in �slope�), presumably attributable to flocculation of micelles. The sharp decrease in slope is accompanied by an increase in �offset�. There is apparently another transition accompanied by a slow decrease in slope and a decrease in offset. There is so far no explanations hypothesized for this behavior in the discussions. Best Christian | ||||
Christian Hansen (chha) Advanced Member Username: chha Post Number: 23 Registered: 6-2010 |
Hi Don, Answer to your question concerning the relationship between MSC slope and particle size. I found two studies that find that increasing particle size (grounded carbohydrates) results in increasing slope of spectra (attached) � thus slope is proportional to particle size. In the spectra of coagulating milk the slope decreases, although we know that particles size is increasing (big particles being made from small particles flocculating) � thus slope is inversely proportional to particle size. Thus, it seems one cannot generalize about slope in spectra and particle size. Maybe it has to do with whether its particles in suspension (milk) and powders. Or that the particles (micelles) in milk are 100 - 500 nm and that the powder particles are (> 20,000 nm). Christian
| ||||
Christian Hansen (chha) Advanced Member Username: chha Post Number: 22 Registered: 6-2010 |
Hi Karl, In your post 39, you speculate whether some radiation can go around sample as opposed to through the sample. I am in doubt whether I have communicated the experimental setup clearly so I have attached an illustration, just so that we are clear about the measuring principles used in the experiment. For transmission I don�t see how radiation can go around the sample when there is liquid milk in the light path of the fiber probe?? To Karl and Don: Maybe we have misunderstood each other regarding measuring reflectance and transmission on �the same sample�. As the illustration shows �the same sample� refers to the same bulk volume (5 L) of milk. It is not one probe that can measure both transmission and reflectance on the same 1 mm of coagulating milk. I guess the misunderstanding means that I cannot actually do the �log(R+T) trick using my spectra, because the milk being measured with the reflectance probe has infinite thickness. Or what?? Regards Christian
| ||||
Donald J Dahm (djdahm) Senior Member Username: djdahm Post Number: 47 Registered: 2-2007 |
Would someone be willing to tell me whether in their experience (as opposed to theory) the MSC �slope� increases or decreases as particle size increases? What kind of samples (powder, slurry, etc)? What on a pratical basis does the "offset" tell you? | ||||
Karl Norris (knnirs) Senior Member Username: knnirs Post Number: 39 Registered: 8-2009 |
Christian, This is pure speculation about the transmission spectra. Assume some of the radiation striking the sample goes around the sample and reaches the detector without going through the sample. This would explain the spectra you have recorded, such that as the scatter increases, the reflection increases causing a baseline change, but the radiation going through the sample does not change. This could be tested by making a transmission measurement on samples using a pathlength of 1 mm in an open cell, with blocking of the stray light. A measurement on a zero time sample and a sample with 50 minutes of coagulation should answer my speculation. Karl | ||||
Karl Norris (knnirs) Senior Member Username: knnirs Post Number: 38 Registered: 8-2009 |
Christian, Thanks for the info. You note that the reflection and transmission spectra were obtained at the same time. This should not be interpreted as identical samples, but two spectra collected with different probes at the same time. I am interested in an explanation for the large change in the baseline over time for the transmission spectra, with very little change in absorption. Is all of the baseline change caused by reflection changes at the initial surface, and not within the bulk of the sample? Karl | ||||
Christian Hansen (chha) Advanced Member Username: chha Post Number: 21 Registered: 6-2010 |
For each "Batch" 5 L of milk was coagulating in a 6 L squared cheese vat. The NIR spectra were recorded using two immersion probes: reflectance and transmission that were inserted vertically from the top of the vat. Thus, the reflectance probe was pointing towards the bottom of the vat and the light path (1 mm) of the transmission probe was also vertical. As mentioned the probes were positioned with a horizontal distance of 5 cm from each other. I used the Antaris MX FT-NIR Process Analyzer from Thermo. The reference spectra was acquired using a built-in reflectance standard of 99%. For transmission it was air. Both probes were connected to the same spectrometer (the Antaris MX), which is a multi-channel spectrometer transmission was measured simultanouly as reflectance. | ||||
Karl Norris (knnirs) Senior Member Username: knnirs Post Number: 37 Registered: 8-2009 |
Christian, I am also confused by the change in the reflection and transmission spectra at different times. What is the optical geometry? Are the samples in a vertical or horizontal position? What windows are involved? Is the reflection spectra corrected for 100% reflection standard? Karl | ||||
Christian Hansen (chha) Intermediate Member Username: chha Post Number: 20 Registered: 6-2010 |
Hi there, In comparing NIR transmission and reflectance spectra of the coagulating milk I noticed that changes occur earlier in the reflectance spectra than the transmission spectra. Is that to be expected and why is that? First I thought that it was because of local differences in coagulation rate inside the cheese vat (distance between reflec and trans probes app. 5 cm), although it seemed like a large lag phase in the coagulation progress. However, the trend is the same for all 12 batches analyzed, so it seemed unlike to be due to local differences in the actual coagulation. Therefore it seems like reflectance and transmission measurements are measuring different coagulation events. Seems like transmission measurements are not so sensitive to the early casein micelle aggregation stage, but more to the later gel formation stage. Can you explain that ? I've attached two figure that show the delayed sensitivity of transmission measurements. 1) The four spectra I have shown before. Notice that little change can be seen in the transmission spectrum at 8 minutes compared with the corresponding reflectance spectrum. 2)The development first principal component with coagulation time for two batches. Dashed lines are based purely on qualitative interpretation of coagulation events. Notice that PC1 scores of transmission spectra change later that for reflectance. Best regards, Christian
| ||||
Karl Norris (knnirs) Senior Member Username: knnirs Post Number: 36 Registered: 8-2009 |
Christian, I am attaching a .ZIP file containing the second derivative spectrum of something that is growing in your milk sample over time. This spectrum was created at the suggestion of Dr.Dahm as follows. I converted the log(1/R) and Log(1/T) to R and T and computed -log(R+T) of all spectra. I then subtracted the -log(R+T) spectrum of zero time from each of the -log(R+T)spectra for the different time periods. Then I computed the second derivative usng S.G. with 61 points. The attached spectrum is the result for the longest time period. For each time period this spectrum became greater. I can't explain this activity, but these spectra show the change with time. I hope DR. Dahm will explain. Karl
| ||||
Donald J Dahm (djdahm) Senior Member Username: djdahm Post Number: 46 Registered: 2-2007 |
To Christian: Yes, the {- log(R+T) } plot is a way of getting a better view of the absorption isolated from the effects of scatter than either log(1/R) or log(1/T). However the effect of �pathlength change� is still visible in a group of such plots. (You will notice Karl talks about effect of �pathlength�, when I talk about effect of �scatter�. His terminology is better than mine. I use words that focus too much on the terms that are in the equation, and there is no pathlength in the Dahm Equation. ) The rational behind the plot is that if it�s not transmitted, and not remitted; it must be absorbed. It is not �exact� in the way that log(1/T) is for non-scattering samples. This is not surprising, since log(1/R) is not really a theoretically proper function for remission either. To Dave: I agree that as we increase coagulation time, the effects of scatter in the { - log(R+T) } is less and less evident. In the last spectra, the effect of scatter seems to be completely gone. However, since it went away when we included both remission and transmission, I conclude that this is evidence that the scatter increase is real, rather than an experimental artifact. To Christian: The fact that the effect doesn�t go away in all the spectra suggests we have a part of the story untold. I think your hypothesis that as the surface reflection goes up a larger fraction of remitted light reaches the remission detector may explain this. I have my hypothesis as to why the scatter increases with coagulation time. Scatter occurs at the interface between the two phases. We start out with milk in which we have �particles�, and scatter decreases as we make big ones out of little ones. At some point, the �solids� become the continuous phase, and as coagulation occurs further, the water droplet regions are getting smaller and smaller, increasing the scatter. | ||||
Christian Hansen (chha) Intermediate Member Username: chha Post Number: 19 Registered: 6-2010 |
| ||||
Karl Norris (knnirs) Senior Member Username: knnirs Post Number: 35 Registered: 8-2009 |
Christian, Please show the second derivative spectra for the 4 spectra of your -log(R+T) plot. Karl | ||||
Christian Hansen (chha) Intermediate Member Username: chha Post Number: 18 Registered: 6-2010 |
Yes, Donald is right. Here is the same plot with fractions Christian
| ||||
Donald J Dahm (djdahm) Senior Member Username: djdahm Post Number: 45 Registered: 2-2007 |
Dave: The extra subtraction of 2 log units comes from the fact that he used percentages rather than fractions for R and T. Don | ||||
Karl Norris (knnirs) Senior Member Username: knnirs Post Number: 33 Registered: 8-2009 |
Dave, Protein has a fairly strong band at 1187 nm, and lactose has weak bands on either side. I think we are seeing a protein band. | ||||
David W. Hopkins (dhopkins) Senior Member Username: dhopkins Post Number: 152 Registered: 10-2002 |
Hi Christian, Those are nice spectra now, and seem to clearly show that the scatter effect decreases as time proceeds. Is it possible that you have made an extra subtraction of 2 log units? I think the scale should go from 0 to 2 units rather than -2 to 0. It appears to me that there are at least 2 bands in that low Abs region, at 1150 nm and 1190 nm. Karl, you have said that the 1150 nm band is due to water. Any suggestion about the other band? Best regards, Dave | ||||
Christian Hansen (chha) Intermediate Member Username: chha Post Number: 17 Registered: 6-2010 |
Hi Don, I followed your suggest to convert to -log(R+T). So you are saying that this number should be log(1/T) for a non-scattering sample? Do you mean that this correct for scattering in some way?
| ||||
Christian Hansen (chha) Intermediate Member Username: chha Post Number: 16 Registered: 6-2010 |
To Donald, Yeah, the name "scatter coefficients" is of course a wrong name for the slope and offset. Don't know where I got that from. Christian | ||||
Karl Norris (knnirs) Senior Member Username: knnirs Post Number: 32 Registered: 8-2009 |
Dave, The band at 1786 nm has been identified as a water band by Lois Weyer. See WATER BAND discussion. Karl | ||||
Donald J Dahm (djdahm) Senior Member Username: djdahm Post Number: 44 Registered: 2-2007 |
Christian: Thanks for posting your "hypothesis" (as of now). It's one thing to understand the spectra, and quite another to figure out what it means for your process. Interesting project! If you convert the Remission curve from log(1/R) back to "R", and the corresponding Transmission curve from log(1/T) to T; and then take { -log(R+T) }; you have a measure roughly comparable to log(1/T) for a non-scattering sample (in which case: {R=0} ). All by itself, this may be an interesting piece of data. I have a program that can extract the absorption and remssion coefficients from the R and T data. The formulas to do this are also in the article you took the Figure from. It's the set of parametric equations numberd (7). The theory assumes "perfect" data on an absolute scale. It's quite a bit of work for an uncertain outcome. [email protected] | ||||
Donald J Dahm (djdahm) Senior Member Username: djdahm Post Number: 43 Registered: 2-2007 |
Christian: You said: "The principal components captures both absorbance and scatter variation," That is true, though I've wondered: If the first component was forced to be a water (transmission) spectrum, would the remaining spectra be easier to interpret in terms of scatter and the other conponents? (This is not my specialty.) "whereas the rationale behind scatter coefficients is that they only capture scatter variation (or what?)" The true remission (or reduced scattering) coefficient is not independent of absorption. In fact, it tracks the absorption spectrum quite well. I can give you plenty of references on this. However, the "(offset and slope) from MSC" are not "scatter coefficients". (I'm curious how you came to give them that name.) However, they are parameters that frequently relate to the scatter far more closely to scatter than to absorption (though other conditions must be met for this to hold). | ||||
Christian Hansen (chha) Member Username: chha Post Number: 15 Registered: 6-2010 |
It is a fact that � big particles are being made from little ones� because milk coagulation is flocculation of casein micelles (100 � 500 nm) followed by formation of a big network using the flocculated micelle strands as building blocks. Based on the inputs given and from my intuitive point of view, here is what I hypotheses is going on as milk coagulates. When small particles form bigger particles the fate of incident light changes like this 1) The distribution of reflection angles off the particles will be narrower i.e. like going from at matte surface (isotropic scattering) to a mirror-like surface (anisotropic scattering). For reflectance measurements, this means that more light is going back to detector i.e. explaining why log(1/R) decreases during coagulation. 2) As particles become bigger, transmission of light through the milk decreases, which is realized by imagining the particle in the attached figure increasing in size. Well, to summarize, I think I understand from your comments that we agree the change in scatter is wavelength dependent both for transmission and reflectance. The unsolved question is of course still why that is. The other unsolved question is whether the observed OH peak narrowing during milk is due to non-linearity, hydrogen bond changes or a third thing. Maybe we will understand someday :-) To Don: I don't know how to "estimate absorption, remission, and transmission fractions" as you ask for (your post 40) Best regards, Christian
| ||||
Christian Hansen (chha) Member Username: chha Post Number: 14 Registered: 6-2010 |
To Dave, Yes, the PCA is made using the original un-processing data. | ||||
David W. Hopkins (dhopkins) Senior Member Username: dhopkins Post Number: 151 Registered: 10-2002 |
To Manoj Oak, You really should start a new thread for your question. Tony or Ian, can you move these items for us? **Moved to http://www.nirpublications.co.uk/cgi-bin/discus/show.cgi?tpc=5&post=4571#POST4571 - Ian The question you ask is very controversial, and there has been considerable discussion of the shoot-out data from IDRC-2008 of Phil Williams on the determination of hardness of wheat. I think that Phil's conclusion is that there are no underlying chemical determinants of hardness so it cannot be determined directly by NIR. However, I think that hardness is a complex interaction of protein and starch properties, and should eventually be detected by NIR, but that it will be necessary to use a wide wavelength region and good, repeatable measures of hardness. I expect that obtaining good calibrations for hardness will take many more samples than 50, and a lot of careful work. I don't think this was the answer you would like, but I hope it helps. Please read Phil's publications in NIR News and JNIRS. Best regards, Dave | ||||
David W. Hopkins (dhopkins) Senior Member Username: dhopkins Post Number: 150 Registered: 10-2002 |
Hi Christian, The PCA plots are interesting. First, I would like you to verify, you made the PCA with the original data, uncorrected by MSC? PC1 is essentially the average spectrum, and the PC1 scores plot looks just like the MSC slopes plot, I suggest because they are looking at the same phenomenon, the overall scattering changes of the samples. PC2 is really focussed on the 1445 nm water band changes, and I think we can see the water band about 1150 nm that Karl has mentioned, and another at 1780 nm that I cannot explain. Do you have a suggestion, Karl (or anyone)? It seems to me that the shape of the PC2 plot is just the inverse of the PC1 plot, and that PC2 is explaining (or changing with?) the scatter changes. PC3 is particularly hard to interpret. This is usually the case as we get to higher PCs. However, I have always had a problem with the 1445 nm region, from the early days when I tried to produce moisture calibrations for wheat flour using the moisture band at 1445 nm, and failed. I now think it is because there are also considerable contributions from -CH-, -CH2-, and -CONH2- amide superimposed in this spectral region. PC3 shows a huge sensitivity to slope changes over the entire spectral region, so it is explaining more scatter variability. In addition, it has a negative peak at approx 1380 nm and neighboring positive peak at about 1430 nm that may show this protein-moisture interaction. In addition, there are indications of (protein?) -CH-, -CH2- at 1720 nm. I'm not sure I trust an indication of a negative band at about 1850 nm. Anyway, the PC3 scores plot may be indicating the complex protein changes that may be happening in the curing of the protein matrix. I hope you can eventually explain these effects by your research into the coagulation process, Christian. I wonder whether there are any known inhibitors at various steps of coagulation whose effects you might investigate? Is rennin affected by SDS sodium dodecyl sulfate? It may be too severe, but it certainly is used to disrupt protein-protein interactions, and might be interesting at low concentrations? Best wishes, Dave | ||||
Christian Hansen (chha) Member Username: chha Post Number: 13 Registered: 6-2010 |
To Dave (post 149) The milk coagulation process attempts simulate the process used for cheese manufacturing, but without adding an acidifying culture order to keep it simple: t=0, rennet (enzyme) is added to milk, which is stirred for 30 s. t=0.5 - 50 min. The system is then left alone, because physical interference induces syneresis (i.e. expulsion of whey (water and water-soluble components). Local spontanouos syneresis can occur when the pressure of gel network becomes too big and this may happen at the end of the process in the present data. But there was not any visible separation in gel and whey nor color changes. I believe however that it was possible to visually grasp the change in scatter properties as the gel appeared to have a more glossy/shiny surface than the milk. | ||||
Christian Hansen (chha) Member Username: chha Post Number: 12 Registered: 6-2010 |
To Dave: Milk coagulation reactions are very sensitive, but the experiments were performed in a 5 L cheese vat emerged in a water batch at 32.5C. This resulted in T=32.0C +/- 0.2 in the coagulating milk, monitored by thermometer. The NIR measurements were made by immersion reflectance and transmission probes. To my knowledge (and a brief literature search) milk coagulation reactions does not produce or consume heat, but anyway the temperature was controlled by the waterbath. This means that if the observed peak (OH str. 1445 nm) narrowing is due to a change in hydrogen bonding it is not a temperature effect, but something else going on during gel formation. As you suggested I have attached a figure showing the development in principal component scores during coagulation time and their corresponding loadings. Not surprisingly the development in PC1 scores is similar to the development in the scatter coefficients (offset and slope) from MSC, because scatter changes explain the majority of variation present in the spectra. Noteworthy is also that the water peak dominates the loadings from the 2nd PC. More than three components seems to be fitting noise I think however that looking at scatter coefficients from MSC is more informative than PCA, when the purpose is to understand NIR absorbance and scatter properties of coagulating milk. The principal components captures both absorbance and scatter variation, whereas the rationale behind scatter coefficients is that they only capture scatter variation (or what?) Best regards Christian
| ||||
Karl Norris (knnirs) Senior Member Username: knnirs Post Number: 31 Registered: 8-2009 |
To Christian, Looking at your ReflectanceVsTransmission02.pdf of June 10. For the transmission spectra I see an increase in pathlength, and an upward shift in baseline as coagulation time increases. The increase in pathlength is greatest at the low wavelengths, and may approach zero effect at the highest wavelength. I am not able to state if the baseline shift changes with wavelength. For the reflection spectra, as coagulation time increases, I see an increase in pathlength, and a shift down in baseline. I can't be certain, but it appears that the changes in pathlength and baseline may be the same at all wavelengths. These observations are slightly different from my previous, because I am looking at different data. I don't know if these observations are of use to you, but if you would like a more detailed examination, I will be glad to provide it, if you make all of the original digital spectra available to me. Karl [email protected] | ||||
Donald J Dahm (djdahm) Senior Member Username: djdahm Post Number: 42 Registered: 2-2007 |
As I said, I initially assumed that the scatter would decrease with increasing particle size which would in turn increase with coagulation time. However, the increase with time in the background level of the transmission spectra convinced me I should be considering otherwise. Coupled with that, there is a decrease in the Absorption/Remission metric with time, as observed in the remission spectra. This includes the trough at 1680. Since, in the �linear region� of a remission spectum, the metric is proportional to { a/r }, this could be due to either a decrease in absorption of the particles or an increase in remission. I choose to go with increasing remission in this case. As I see it, the slope in the MSC plot is another way to examine { a/r }. It goes down with time over much of the plot, which I again interpret as due to either a decrease in absorption of the particles or an increase in remission. What do some of the rest of your think? Neither Dave nor I are in this to win an argument. We�re trying to understand what�s going on. As far as the changes of slope in the MSC plots go, I must say I did not see that before. I�d be very interested in an explanation from someone. | ||||
Donald J Dahm (djdahm) Senior Member Username: djdahm Post Number: 41 Registered: 2-2007 |
If all that is happening is that big particles are being made from little ones, a decrease in scatter with time is what one would expect. That is how I interpreted the emulsion spectra in NIR news a few issues back. That was my first assumption in this case. However, I became persuaded that the opposite was true in this case. I may have screwed up. It wouldn't be the first time. I will look at the data again: specifically the areas you mentioned. In the meantime, feel free to pick apart the analysis further. That's how we make progress. Thank goodness that we reserved the right to be smarter tomorrow than we are today. Don | ||||
David W. Hopkins (dhopkins) Senior Member Username: dhopkins Post Number: 149 Registered: 10-2002 |
Hi Don and Christian, Don, your analysis written to Christian is very interesting, and I shall have to re-read it several times to 'absorb' it fully. However, you said several times that the scatter increases with coagulation times. I would suggest that the original spectra show that the absorbance at the trough of about 1680 nm goes down with increasing time, and that is a measure of the scatter in the samples (see {6663}). Additionally, the MSC slopes (see {6674}) decrease in 2 phases, that is also a measure of scatter. Therefore, it seems that the scatter actually decreases in the experiment. Did you actually mean to say, scatter decreases with time? Christian, what did the samples look like, and how did you treat the samples as the coagulation proceeded. Obviously, the initial milk was a uniform white color. As the coagulation proceeds, does it still appear white? Does it still appear uniform, or did you have to stir it or otherwise treat it to keep the particles from settling? Or, is the 'gel' more like yogurt, apparently uniform and white? Is there any indication of a separation into curds and whey? Best regards, Dave | ||||
Donald J Dahm (djdahm) Senior Member Username: djdahm Post Number: 40 Registered: 2-2007 |
Jerry: Thank you very much. Dave: I have certainly looked for such a function: it�s the �Holy Grail� of remission spectroscopy. Unfortunately, it doesn�t look like it�s coming on my watch. However, I think I could help some software guru in getting a non-linear regression that had the correct theoretical form. Using the Representative Layer Theory, we are in a situation where we can predict the metric from particle properties, but can�t go backward. I think that if Christian would be good enough to use his transmission and remission data to estimate absorption, remission, and transmission fractions, it would give us some of the insight we are looking for. Even then, as shown by the Dahm Equation: A(R,T) = (1 � R2)-T2 / R = (2-a-r) a/r (where a and r are particle properties), because a is both a multiplier and is subtracted, the metric is a non-linear function of a (for a specific value of r ). Furthermore, one cannot escape the fact that scatter and absorption are intertwined, and when we get an absorption coefficient from a sample, its value is dependent on the level of scatter. My best shot is determining the absorption and remission coefficients (K and B; and then using a truncated remission coefficient (B-B0) where B0 is the remission coefficient at zero absorption; and then relate the �true� absorption coefficient k to the observed coefficients by: k = [K+(B-Bo)(weight)]/slope [That�s on page 97 of our book.] Don | ||||
Jerry Jin (jcg2000) Senior Member Username: jcg2000 Post Number: 31 Registered: 1-2009 |
Dear Donald Dahm, I take the liberty of converting your file into a PDF file, so most people here can open and read it. Best, Jerry Jin
| ||||
Donald J Dahm (djdahm) Senior Member Username: djdahm Post Number: 39 Registered: 2-2007 |
Well, Karl, I'm quite sure I didn't explain everything, but I gave my story.
| ||||
Karl Norris (knnirs) Senior Member Username: knnirs Post Number: 30 Registered: 8-2009 |
To Tony, Thanks for the conversion. To Christian and to Don. It appears to me the data for the 1400 nm region is very similar to that of the 1780 nm region, and quite different for the 1150 nm region. In my first post I described a situation where the scattering particles did not change, except increase in number. It appears the spectral changes we observe in your spectra are related to the change in size and shape of the particles crested by the coagulation, such that they affect the lower wavelengths more than the higher. I believe Don is going to give us a possible explanation, and I look forward to his idea. Karl | ||||
David W. Hopkins (dhopkins) Senior Member Username: dhopkins Post Number: 148 Registered: 10-2002 |
Hi Christian, I don't recall getting an answer to my question, did you perform the reflection and transmission measurements using a thermostated cell? I don't know much about the process of coagulation, but I guess that it is complicated. If it is either exothermic or endothermic, that is another reason to thermostat the cell, to minimize the temperature effects. I assume that all the spectral data you have presented lately was on the MSC-corrected data? Don, from your analysis, do you have another equation that suggests a different treatment that might better separate out the scatter effects? I wonder if a couple techniques would be helpful in sorting out the spectral changes you observe during coagulation. The first would be PCA. I would suggest not using mean-centering, and follow the scores over time. Each principal component would show you the spectral signatures that are changing in the scores vs time plot, and you could make such plots for as many factors as appear significant. The second method that occurs to me is 2-dimensional correlation spectroscopy. I know that Yuki Ozaki has published a lot using this method. I think that Pierre Dardenne has used it. I have no experience with it myself, but it might sort out the water and protein changes that are happening. I think you have enough work here for a good part of an interesting thesis, and there are many more experiments you will want to do. Your challenge will be to relate what you see to what is already known about retting chemistry, and see what the NIR spectroscopy adds. Best regards, Dave | ||||
Christian Hansen (chha) Member Username: chha Post Number: 11 Registered: 6-2010 |
To Tony. Yes all the numbers are there. Thanks Christian | ||||
Christian Hansen (chha) Junior Member Username: chha Post Number: 10 Registered: 6-2010 |
Hi Karl Here's the development in 2nd derivative at approximately 1780 nm as coagulation proceeds. I observe that reflectance and transmission are inversely proportional, but show the same development.
| ||||
Tony Davies (td) Moderator Username: td Post Number: 232 Registered: 1-2001 |
Karl, I've managed to open Christian's file with "Open_Office". It was a zip file of some sort so I've saved it as an Excel spreadsheet. I will try to up-load it. Christian Did I get the whole file? Best wishes, Tony
| ||||
Karl Norris (knnirs) Senior Member Username: knnirs Post Number: 29 Registered: 8-2009 |
Christian, Your data become even more interesting, and more difficult to understand. My computer would not open the "table" file, but your plots provide the info I was seeking. Looking at the transmission data,I suggest that the effective optical pathlength decreases slightly with coagulation time. The amount of decrease appears to be slightly greater for the 1400 nm band compared to the 1150 nm band. Both of these bands have been identified as water bands by many others. These data do not suggest saturation. Looking at the reflection data, I am confused. The data at 1150 nm suggests a rapid decrease of pathlength over the first 10 minutes, and no change for the next 40 minutes. The data at 1400 nm suggests an almost linear increase in pathlength over the total time. Seeing these data I now suggest the 1790 nm data may be very useful. To Don, I hope you can offer a possible explanation for these spectral effects. With regard to the band at 1350 nm, it appears that essentially all of the components of milk have a slight increase in absorption going from 1320 to 1360 nm. Karl | ||||
Jerry Jin (jcg2000) Senior Member Username: jcg2000 Post Number: 30 Registered: 1-2009 |
Christian, great spectra and plots! I am also curious of the scattering theory and chemistry behind these data. Jerry Jin | ||||
Christian Hansen (chha) Junior Member Username: chha Post Number: 9 Registered: 6-2010 |
Thanks again all of you for helping me understand what the spectra are showing about coagulating milk. To Karl: Here are values you were asking for: minimum of 2nd derivative (SG) at approximately 1150 and 1400. The reason I write "approximately" is that the minimum changes position along the wavelength axis as coagulation proceeds. Also just so I understand you correctly: 1150 is a water free spectral area dominated by the 2nd overtone from CH2 vibrations. Right? 1400 nm is at the edge of the spectral area of 1st overtone OH vibrations, but also the edge of CH2 combination. I am not sure I understand how you will use this to argue for or against non-linearity? //Christian
| ||||
Donald J Dahm (djdahm) Senior Member Username: djdahm Post Number: 38 Registered: 2-2007 |
You gave me exactly what I asked for, and did so beautifully. Adding the color, shall I say, was "inspirational". I will post a document detailing my conclusions from this data, along with a few "watchouts". It will be in the form of a "note" to you, though obviously others may see it, and decide to disagree. I'm sorry Karl said to disregard the 1790 band (He's usually right about these things), becasue I'm going to use it in my argument. Also, I hope that the band around 1350 is due to non-aqueous components, because it will strengthen my argument. (I'm not much of a chemical spectroscopist, or I would know that.) I'm going to argue that we are seeing the normal non-linearity of the Absorption-Remission response coupled with a change of the scattering coefficient as a function of wave length. Don | ||||
Karl Norris (knnirs) Senior Member Username: knnirs Post Number: 28 Registered: 8-2009 |
Christian, I would tend to ignore the 1790 nm band, because it is likely to have non-linearity problems. The band at 1150 nm should have the least non-linearity, so I would like to see a table showing the minimum value of the second derivatives in the 1150 and 1400 nm region for all of the reflection and transmission spectra. Unfortunately your instrument noise causes a problem in the 1150 nm region for transmission, but the numbers may still have some value. Hydrogen-bonding should show in the second derivative spectra. Look at the 1360-1550 nm region on an expanded scale. I don't see any evidence on the plots you have provided. Karl | ||||
Christian Hansen (chha) Junior Member Username: chha Post Number: 8 Registered: 6-2010 |
And the second plot. Notice that the blue region (water free) keeps being linear but with a changing slope and offset. In the red region there is sort of a quadratic relation between the milk spectra and the coagulating milk spectra. The green also seems linear. I am not sure if I understand what you meant, Don Dahm? Christian
| ||||
Christian Hansen (chha) Junior Member Username: chha Post Number: 7 Registered: 6-2010 |
Hi Donald Dahm, I followed up on your suggestion with these two plots
| ||||
Christian Hansen (chha) Junior Member Username: chha Post Number: 6 Registered: 6-2010 |
To Karl, I am not understanding the part about using 2nd derivatives. Should I compare the difference in 2nd derivatives at 1445 nm and 1790 nmm?
| ||||
Christian Hansen (chha) New member Username: chha Post Number: 5 Registered: 6-2010 |
Hi Karl Here are some more transmission spectra. I am only showing every third minute spectra for simplification. Best, Christian
| ||||
Donald J Dahm (djdahm) Senior Member Username: djdahm Post Number: 37 Registered: 2-2007 |
I�d like to suggest a way to determine whether we are observing altered chemical species, or if we just have the normal non-linearity in a form that we are not used to seeing. (We usually see the absorption of the particles, not the matrix.) You could prepare a series of plots where the x coordinate is the log(1/R) value of the milk spectrum, and the y coordinate is the corresponding value for the spectrum under consideration. For the milk spectrum, this would be a straight line at 45 degrees. For the others, there will be a straight line with a different slope and offset going out to about 1.5 (as shown by you MSC correction), then becoming a curve with changing slope. If each plot is a smooth curve, then the effect is probably explainable by the theory I mentioned. If there are departures, then an effect like changes in hydrogen bonding is more likely. As far as Karl�s posts go: 1) The effect of surface reflection is included in the �r� of the Dahm equation, while the effect of stray light is not. 2) Neither Kubleka-Munk or log(1/R) are linear functions of concentration of absorbers (except in infinitesimal particles). In a problem like this, we are not dealing with a situation that it matters much which you use. There are many practical advantages in using logs that have nothing to do with the theory of diffuse reflectance, some of which have been highlighted by Howard Mark in this Forum. The Absorption/Remission metric is proportional to Kubelka-Munk for infinitely thick samples. It has a theoretical significance that log(1/R) does not. | ||||
Karl Norris (knnirs) Senior Member Username: knnirs Post Number: 27 Registered: 8-2009 |
To Christian, You have very interesting data, and we would like to understand your data. When I state that the absorption bands should become stronger, I am referring to the magnitude of the bands after correcting for baseline. The best way to compare the strength of the bands is the use of a second derivative. I made a crude attempt to correct for baseline by estimating the distance on your graph from the peak at 1445 nm minus the value at about 1640 nm. Here are my estimates: zero time 44 8 time 50 15 time 60 49 time 67 These numbers show the increase in the strength of the water band. You should compare the second derivative values at the two water bands. Any non-linearity could be caused by stray light, surface reflection, or the effect noted by Dr.Dahm. Without further info I would not make an assignment. I am surprised by your transmission spectra, which indicate a much greater differnce between the magnitude of the two water bands compared to reflection. I would like to see all of your transmission spectra. Karl | ||||
David W. Hopkins (dhopkins) Senior Member Username: dhopkins Post Number: 147 Registered: 10-2002 |
Hi Christian, Your MSC coefficients plots are really lovely, they nicely summarize the scatter changes you observe in the spectra acquired during coagulation. The MSC-corrected spectra clearly show the apparent band sharpening and enhancement as coagulation proceeds, which has been a matter of some debate here, and I fully accept that there are more aspects than just stray light at play. However, I don't think you can start theorizing yet about hydrogen bonding, without addressing some experimental points. First, I think you should be running these experiments under carefully controlled and constant temperatures, because the hydrogen bonding of water is highly temperature dependent. Secondly, the transmission spectra in the 1 mm cell during clotting should also show the scattering changes, and I wonder whether they show the same behavior as seen in the reflectance spectra. The transmission spectra may be a little easier to interpret. Best regards, Dave | ||||
Christian Hansen (chha) New member Username: chha Post Number: 4 Registered: 6-2010 |
To Karl Norris comment on the optical arrangements for the measurements. I used the Antaris MX FT-NIR Process Analyzer from Thermo with the accompianing reflectance probe. The reference spectra acquired using a built-in reflectance standard of 99%. It is a multi-channel spectrometer so I actually also measured transmission simultanouly as reflectance using a probe with 1 mm path length. Best, Christian
| ||||
Karl Norris (knnirs) Senior Member Username: knnirs Post Number: 26 Registered: 8-2009 |
First to Howard Mark. It was not your name that caused my distraction. It was my neighbor,Howard Brooks, because he started to mow his lawn as I started to write my comments addressed to David Hopkin. Sorry that name confusion seems to be more of a problem now. With regard to Dave's comments, Donald Dahm, has pointed out one effect and there is another, the effect of surface reflection. Not knowing the optical arrangements for the measurements, we can not evaluate the possible causes of any non-linearity and assign the non-linearity to one of three possible sources. To venkynir, I am not familiar with SPA, so I can't comment further. The conversion of diffuse reflection data to Log(1/R) or Kubelka Munk units is widely debated, but I believe Log(1/R) has wider acceptance. Karl | ||||
Christian Hansen (chha) New member Username: chha Post Number: 3 Registered: 6-2010 |
Hi all, First I would like to thank you all for your elaborate and shift answers. It is really nice to get your help in understanding NIR as well as the literature references. I hope my questions did not start a conflict between Mr. Norris and Mr. Mark :-) There was however some issues I did not follow. 1) Karl Norris wrote: �As we continue to add scatter the Log(1/R) baseline goes down, and the absorption bands of the liquid become larger.� Do you mean absorptions bands become broader? In that case the opposite is observed in the present spectra as the OH stretch band at 1445 nm clearly becomes more narrow as the Log(1/R) baseline goes down (i.e. as coagulation proceeds). Could the following hypothesis explain peak narrowing? I know that hydrogen bonding (H-bonds) can alter the bandwidth of OH stretching vibrations because single or multiple H-bonds to OH damps the frequency of OH vibrations. Could this explain why the OH peak becomes narrower during milk coagulation i.e. the concentration of hydrogen bonding diminishes as milk coagulates? 2) As I understand your comments, most of you argue that log(1/R) at the water band (1445 nm) is saturated, which causes peak flattening. I guess �saturated� means that so little light is returning to the detector, that there is a non-linear relation between concentration of photons and detector response. Is that understood correctly? But then I am just wondering why the water band is also becoming narrower at the sides of the peak, where the log(1/R) is say 1.6 and therefore should be within a linear range. 3) I followed up on David Hopkins idea on performing MSC on a segment of the spectrum. I chose a region free of water 1050 -1250 nm. I chose the initial spectra (milk) as reference spectrum for MSC. In the attached figure I plotted the slope and offset coefficients(from MSC) versus milk coagulation time, which describe how the baseline develops with time. From dairy literature I interpreted the development as I) size reduction in casein micelles due to proteolysis of the outer layer of micelles II) flocculation of micelles and III) network formation � gel firming. What do you think of this approach of using MSC coefficients? Best regards, Christian
| ||||
Donald J Dahm (djdahm) Senior Member Username: djdahm Post Number: 36 Registered: 2-2007 |
Christian: In a recent �Speaking Theoretically� column [NIR news; Volume 21 Issue 3 Pages 9�14 (2010)], we discussed these kinds of systems. There you will find an explanation similar to the one Karl gave. That�s not surprising since I learned this way of looking at things from him, and I call his system the �intuitive approach�. In Figure 4, there are spectra from two aqueous emulsion samples, which probably have a larger size difference than your range of samples. The bunching up of the spectra around 1380 nm in your spectra actually becomes a crossover point in mine; the suppression of �absorbance� is that much greater at 1445 than 1200. (How about that, Dave!) Both stray light and front surface reflection put an upper limit on the absorbance that can be observed from a particular sample, but in remission, the stray light is usually the smaller contributor. One way to explain why the spectra are more suppressed at higher absorbance values is to use the Dahm Equation, which say that the Absorption/Remission metric is equal to { ( 2-a-r) a/r }, where a is the absorption by a particle and r is the remission from it. At low absorption levels the metric is proportional to a/r; while at high values of a, there is a large value to subtract. About different kinds of scatter: I think we would do well not to talk about different �kinds of scatter�. The names we attach are mathematical solutions to describe scatter from different �kinds of particles�. Raleigh had a solution for particles much smaller than the wavelength. Mie had a solution for spherical particles of any size. Stokes had a solution for normally illuminated plane parallel layers. There is a bit about this in �The struggle to understand the theory of diffuse reflectance, part 2�; NIR news; Volume 17 Issue 2 Pages 12�15 (2006). I tried to give a feel for the origin of scatter in articles called �Making Waves� [NIR news; Volume 16 Issue 6 Pages 15�16 (2005)] and �Making More Waves� [NIR news; Volume 16 Issue 8 Pages 8�14 (2005)]. Don Dahm | ||||
Ana Garrido-Varo (garrido) New member Username: garrido Post Number: 5 Registered: 1-2006 |
Crude edible oils contain a variety of undesirable impurities. If you plot oils with an increasing amount of impurities you will clearly see the scatter effect on the spectra. When I work with extra virgin oil and I clearly see a fat baseline. However if I work with rendering fats which can have sometimes an important amount of impurities the scatter effect is visible to your eye. | ||||
venkatarman (venkynir) Senior Member Username: venkynir Post Number: 102 Registered: 3-2004 |
Karl I have seen good amount of work going on measurements of granulation through NIRS for pharma.. people applied Kubalca method for granulation measurement through scattering . What about applying SPA? .Is there any scatter effect there in Edible oil? | ||||
David W. Hopkins (dhopkins) Senior Member Username: dhopkins Post Number: 146 Registered: 10-2002 |
Hi Karl, I'm sure you meant to disagree with me in your last post. I'm interpreting the flattening of the curves at 1445 nm as an effect of stray light, and we can observe that the differences between the curves at the peaks of approx 1445 nm are considerably less than the differences at 1200 nm, for example. This is the "saturation" effect that I am interpreting as due to stray light. I am interested in your opinion. If this is not a stray light effect, how do you interpret these spectral effects? Best regards, Dave | ||||
Howard Mark (hlmark) Senior Member Username: hlmark Post Number: 327 Registered: 9-2001 |
Karl - I didn't say anything about stray light. In fact, I haven't posted a comment to this thread before. I know I tend to run off at the keyboard sometimes, but you can't blame me for EVERYTHING that goes on in Near-Infrared!!! :-) \o/ /_\ | ||||
Karl Norris (knnirs) Advanced Member Username: knnirs Post Number: 25 Registered: 8-2009 |
Howard, I usually agree with your observations, but I think you are in error in attempting to define the stray light with the presented spectra. These are diffuse reflection spectra where the radiation source is the back-scatter from particles in water. There are a number of interactions involved as coagulation increases, and many of these affect the magnitude of reflection at 1445 nm. To Christian,I suggest comparing the magnitude of the second derivative ratio of the two water bands as coagulation progresses. I also suggest making transmission measurements with a 1 mm pathlength to gain more information about your samples. Karl | ||||
David W. Hopkins (dhopkins) Senior Member Username: dhopkins Post Number: 145 Registered: 10-2002 |
Hi Christian, To add some points to Karl's response, the scattering you are observing is probably neither Mie Scattering, which requires single-particle scattering, nor Rayleigh scattering, which is due to very fine particles on the order of the wavelength of light. You are observing multiple scattering by particles and networks orders of magnitude larger than the wavelengths of the measuring light, as nicely described by Karl. Karl's point about saturation is important in your spectra. I am surprised that the 1445 water band is showing saturation well below 2 Absorbance Units, which suggests that your spectrometer has more than 1 percent stray light, that tends to flatten the band and clip it at about 2 AU. The effect of this is that you should limit your MSC calculations to avoid the wavelengths at approximately 1380 nm to 1550 nm, and also WLs above about 1820 nm. Then, you can use the information in the remaining regions to study the chemistry of the proteins and quantify the fats in your samples, if that is your goal. Sensitive measurements using 1st or 2nd derivatives may help you to see what is happening to the bands in the WL windows you have available. You should search the site for rather extensive discussions of derivatives. Welcome to the website, and I wish you much success in your studies of cheese using NIR. Best wishes, Dave | ||||
Karl Norris (knnirs) Advanced Member Username: knnirs Post Number: 24 Registered: 8-2009 |
Christian, Here is my story. Let us assume we are measuring diffuse reflection starting with clear water. The diffuse reflection of our sample is zero at all wavelengths. Add a little scatter to the sample and the diffuse reflection increases. As we continue to add scatter the Log(1/R) baseline goes down, and the absorption bands of the liquid become larger. As we add scatter we also decrease the effective optical pathlength of the liquid, so we are working with a non-linear situation. With a large amount of scatter we also obtain non-linearity from stray light and surface reflection, causing saturation of the absorption bands. Changes in the size of the scattering particles have little effect until we approach the size of the wavelengths. I hope this helps, Karl | ||||
Christian Hansen (chha) New member Username: chha Post Number: 2 Registered: 6-2010 |
| ||||
Christian Hansen (chha) New member Username: chha Post Number: 1 Registered: 6-2010 |
Hello I have recorded NIR reflectance (1000 � 1860 nm) continuously (every 30 sec) during coagulation of milk initiated by enzyme (rennet), which is process used in cheese manufacturing. The milk starts to coagulate after approximately 5 minutes and after 15 minutes it has become a gel that become firmer with time. The figure shows four spectra selected at different time points. I am trying to understand what I see in the spectra and link it to scattering physics, which is not my strong point. The first observation I have made is that the main spectral change during coagulation is a baseline change. I could estimate offset and slope changes in the baseline by MSC and, see that both offset and slope decrease with coagulation time. My question is what kind of scattering is going on? Is it Rayleigh or Mie-Lorentz? The size of casein micelles in milk in 100-500 nm. During coagulation the micelles start to aggregate and thus become up to ten times bigger, whereafter they form strands and a network. Can anybody explain how these size changes affect the scattering physics? Help 
|