| Author | Message | ||
Andrew McGlone (mcglone) Advanced Member Username: mcglone Post Number: 21 Registered: 2-2001 |
Tony. Can you please direct me to literature concerning the relative merits of NIR vs IR. I imagine it depends on many matters and advantages of one over the other will vary on a case by case basis. I've been doing some FTIR recently, even comparing ATR vs flow cell also, for VitC measurement on breeding lines of fruit. Using juices and pulps. It is fun and easy stuff to do, and some good results. However I dismissed NIR as a serious option because of prior (but very limited) experience suggesting specificity to a single acid in a mix of acids would be difficult in the NIR range. My question now is to wonder whether it is worth exploring NIR, because I'd certainly like to get better results. It will be a little bit of an effort to get our full range NIR system going so I'm looking for a decent hint that it is worth the effort. I'll duly troll the literature on the matter but your opinion would be valued. Thanks | ||
Tony Davies (td) Moderator Username: td Post Number: 226 Registered: 1-2001 |
Hi Evgeny, Yes, of course you cannot explain everything in the first post - you do not know if anyone will respond. I was just excusing my assumption that you had run a small scale experiment and was trying to get the best out of it. The second assumption, that you were using NIR, was due to the fact that this is an NIR discussion forum. You are, of course, welcome to ask our advice but you have to expect us to be biased towards NIR (there is generally a lot of bias against NIR!). With IR you have problems of high sensitivity and higher detector noise so that NIR has often been found to be a more precise and robust method. The fact that some instrument companies have developed NIR instruments for on-line beer analysis would suggest that NIR is the optimum region for this analysis. However, I did not know your situation but now I understand that as you have an FTIR you have to make it do the beer analysis. My recommendation on the analysis of the data is to concentrate on the question of which accessory to select. It does not matter if your calibrations are over-optimistic you are not going to use them to measure production samples. The point is that you have said that you are not able to use the same wavelength range for all accessories; this will give rise to variations in the way the samples perform - a sample could be an outlier with one accessory but close to the mean with another - so while you might use the same sample sets you should not conclude that there will not be a bias between accessories. I would be very interested to see your results. Yes, the 4T's is a joke and I'm pleased you were amused. There is another more hidden joke; I'm not sure if anyone has ever noticed it. If you look again at our names you will see that not only do we have "T" in common but also "To" or 2 so we are the 42's. If you look at the cover of the book you will see that the result for water on the top of the pyramid of data analysis is 42. This is not a random selection. Everyone who has read Douglas Adam's book "The Hitch Hikers' Guide to the Galaxy" will know that 42 is the answer to everything! Best wishes, T4 | ||
Evgeny (evgeny) New member Username: evgeny Post Number: 3 Registered: 3-2010 |
Thank you Tony. But, it�s difficult to describe all things in one post � takes too much time. That�s why I didn�t tell the details in the first post. I�m going to write this in one article. I read in many sources that cross-validation can give overoptimistic results, because the same samples were used for calibration and validation, that�s why I wanted to use a test set, but exactly the same for all different models. No, these ext-s were done on FTIR instrument (4000-400 cm-1). But why is it a wrong range? There is a lot of information about sugar and alcohol absorption in the fingerprint region (1500-900cm-1). Indeed there are some articles about the same stuff and there are instruments optimised for beer, but we are not pretending to beat them, we use what we have. And that�s why we had to try something �novel� � HTT and �ATR. Moreover, the same samples were used in other projects with Electronic Tongue, taste panel assessment and aroma analysis. HTT is not that difficult to use � it�s possible to measure 95 samples automatically in less than 1 hour (High Throughput) with a very small sample volumes. The point is not to find the best accessories; they all have adv. and disadv. and it is known in advance that ATR approach is superior. The idea is to evaluate the potential of HTT, to check what the difference is, what is the added value of 9 reflections vs. 3 reflections, what is better to use water background or air background and so on. PS: yes, I know why it is called 4T, but I found it fanny. | ||
Tony Davies (td) Moderator Username: td Post Number: 225 Registered: 1-2001 |
HI Evgeny, You did a very good experiment! You have more than enough data but I suggest you are too concerned about the calibration. I would try running some quick experiments; you can often do a lot in a short time. (I started work on NIR when we started the computer before going home and sometimes we had an answer in the morning!) The question you want to answer now is "Which accessory should I choose". You can set-up Unscrambler to do cross-validation on different selections of samples. I would try several, separate calibrations for each accessory and see how they compare. If one is more consistent than the others then your problem is solved. The HHT sounds very difficult to use. Unless it gives really good (repeatable) results I think I would drop this first. Once you have decided which accessory to use then you can start work on the calibration; you will need many more samples. Having said all this I have to ask "Why are you doing this"? There is a lot of published work on beer and there are instruments that have been optimised for beer. Just a minute!..... I have just realised that you said "FTIR" in that case I think you are probably in the wrong wavelength range. Or is this a multiple range instrument and you ARE using NIR? Please let us know. Best wishes, Tony PS 4Ts?? The first names of the authors are: Tormod, Tomas, Tom and Tony | ||
Jos� Ram�n Cuesta (jrcuesta) Junior Member Username: jrcuesta Post Number: 6 Registered: 11-2009 |
Hi again, It,s allways good to sort the samples sets by their constituent values or by their Mahalanobis distance to the mean. So you can select the samples in a way like 1 every 4, for validation excluding the extreme samples in order not to extrapolate. This will give you a similar regression line and validation line. Cross Validation will does something like this but with different combinations. The problem is that in some of the combinations will be the extreme samples for validation and not for calibration. Anyway ramdomize all you can your experiment in order to exclude the bias. Best Regards Jos� Ram�n | ||
Evgeny (evgeny) New member Username: evgeny Post Number: 2 Registered: 3-2010 |
Thank you all for your comments and suggestions. To Jose Ramon and Jose Miguel Hernandez – yes, this is the normal procedure that I would follow, but random selection is hard to achieve for different Ys – I mean that I need to select them manually every time for each Y, since the range and the values are different, moreover there is no guarantee that the samples will be evenly spread over the whole range of concentrations. That’s why I was thinking about more objective way. To David W. Hopkins about stopping clustering: I can choose to select from 2 to 20 clusters in the Unscrambler. So, the question is how many clusters to use? For instance, on the PC1 vs PC2 I can have 20 different groups, some of them contain only 1 sample (the extreme samples), some – 3, some – more. And the explained variance is 100% for 2 PCs because this is my reference values. I also was thinking about 25-25 approach, but then I need to use only 1 point from each cluster and add 5 extra randomly chosen samples – for calibration and the rest 25 will go for validation. 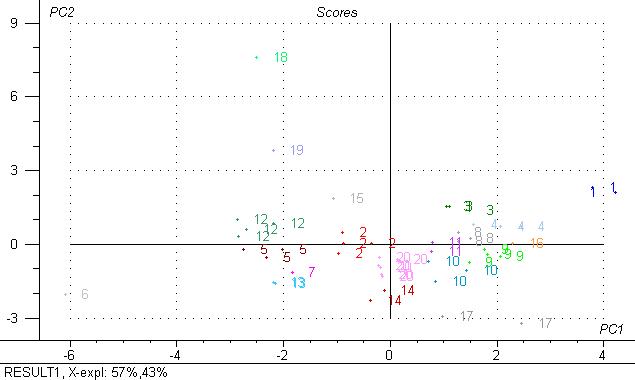 To Tony Davies: yes, all samples were analysed by different accessories. Experimental plan: 50 beer samples and 3 accessories (ATR crystal with 9 reflections, micro-ATR crystal with 3 reflections and High Throughput Transmission accessory). ATR and µATR – 7 replicas were run for each beer sample in random order (50*7=350). HTT: 12 replicas were run for each sample (12*50=600), but this exp-t was repeated 4 times for different sample volumes, since the signal is thickness dependent and it was not known what volume produces the best results. So, 600*4 = 2400. Volumes – 5-10-15-20 µl. Below 5 µl, not possible to put the sample on the accessory, higher 20 – the signal is extremely high. In between 5-10, 10-15, 15-20 – the difference is very small, that’s way this compromise was chosen – to have distinct difference in signal. Why 12 replicas? The spectra are not very stable from one position on the accessory to another for 1 particular sample. But when I have many replicas, then I can get a ‘good’ average response. Reference values – only 1 value available, but this is an average of 3 measurements. These are different beer’s parameters: alc. volume, original extract, fermentation degree, bitterness, pH, polyphones and many others. The accessories are quite different, especially ATR vs HTT (different principles), so I would not use ‘ALL the samples from one of the accessories in the validation set and use all the rest in the calibration’, otherwise the calibration will fall in failure. Moreover, I also need to consider different spectral ranges, and this will not be possible for all data, they will not be compatible So, I was thinking to select one specific sample set objectively for calibration and use the same for each of the accessory and for different volumes in HTT. Important: never worked with MatLab or SAS, so I would use the Unscrambler features for this data analysis, cause I familiar with it. Other people suggested to me to use a procedure like ‘duplex’ which allows creating a calibration set and a validation set which are as comparable as possible. Have you ever herd about this? PS: funny short-name of the book ‘4Ts’ =) | ||
Tony Davies (td) Moderator Username: td Post Number: 224 Registered: 1-2001 |
Hi Evgeny, Welcome to the group. As I'm probably the only one of the 4T's who regularly look at the site; I had better respond. Yes, the proceedure on pages 251-255 of the "4Ts" book is intended for use when you have lots of un-analysed samples and a limited budget for reference analysis. As you have the reference analysis for each of your fifty samples then you will use all the samples in either the calibration or validation sets. However, this form of heirarachical cluster analysis would be quite a useful way of showing if you have obvious clusters that are from particular accessories on your instrument. I am worried about your actual experimental plan. Have all the samples been run on all the accessories? This is what you should have done. Have you mutiple spectra of the same samples on the same accessory? (By this I mean that you are taking a fresh sub-sample every time) This is what you should have done. In my experience there are two problems with accessories. 1) There is a variable off-set from different accessories. 2) There is a difference in the repeatability between different accessories; you need quite a lot of data to sort it out. If you get to doing a calibration I suggest you put ALL the samples from one of the accessories in the validation set and use all the rest in the calibration (you will need to do a cross-validation on the calibration). Repeat for each accessory. Then evaluate the results!! There is a calibration technique called "Indicator Variables" (not in the 4Ts) which might be useful in this context but more of that if you need it! If you would like some more help you need to tell us what has been measured and how many accessories are included in your trial. If you are allowed it may also be useful to know what samples are involved. Good luck and best wishes, Tony (T4 in this case but otherwise TD-1) | ||
David W. Hopkins (dhopkins) Senior Member Username: dhopkins Post Number: 138 Registered: 10-2002 |
Hi Evgeny, I agree with Ramon, you will want to use all 50 of your analyzed samples. However, I don't like to use less than 20 samples for either a training or a test set, so I guess I would recommend splitting the samples 25-25 for training and validation. Then, you could try both strategies for selecting the training set. The clustering suggestion is very good. In my experience the number of groups you observe in the PCA in the plot of the first 2 factors is the maximum you will see when you look at factor 2 vs 3, etc. Usually the cloud reduces to just a single cloud by factor 3 vs 4 or surely by 4 vs 5. So, you could reasonably choose 3 or 4 points per cluster. Remember that the clusters are not independent, when you look at the plots of PC 1 vs 2 and PC 2 vs 3, for example. The random selection suggested by Ramon should also work pretty well, but you may observe that the random method doesn't select samples equally from each cluster. The PCA approach helps you to obtain the maximum significant variability in your training set, and that is good. I would expect that you should not have very many clusters, unless you performed a designed experiment. When the "Four T's" talk about clusters, I think they mean distinct populations, so I don't understand what you mean by when to stop the clustering.... Best wishes, Dave | ||
Jose Miguel Hernandez Hierro (jmhhierro) Junior Member Username: jmhhierro Post Number: 9 Registered: 4-2008 |
Hi, I agree with Jos� Ram�n, you should make a calibration set that covers all the range of reference values. You could also check the Mahalanobis distance (H) obtained from PCA analysis in order to not include samples with spectral extreme values. Regards Jos� Miguel | ||
Jos� Ram�n Cuesta (jrcuesta) New member Username: jrcuesta Post Number: 5 Registered: 11-2009 |
Hi, If you have lab values for the 50 samples, I suggest to split them into a calibration set (75%) and a validation set (25%) and develop the calibration and test it with the validation. Choose the samples ramdomly. (Take care with extreme samples). There are methods to select samples for calibration in case you only have spectra (X), but in your case all the Y values are wellcome . Due to there are not to many samples you should use few terms in PLS or try with MLR for a feasibility study. Regards Jos� Ram�n | ||
Evgeny (evgeny) New member Username: evgeny Post Number: 1 Registered: 3-2010 |
Hi all, I have a question about selection of samples for calibration. I would like to compare the performance of different accessories of FTIR spectrometer to predict some product’s parameters(concentrations). I have 50 samples and I need to select part of them for calibration. I was thinking about the strategy described in a book “User-friendly guide to Multivariate Calibration and Classification”: 1. run PCA on x-data –> 2. run cluster analysis on the scores from the PCA and stop clustering when there are as many clusters as the number of samples one can afford to make the analysis for Y (but actually I have these values for all samples, so the question is when to stop clustering?). 3. Select 1 samples from each cluster – and these are calibration samples. But, if I follow this procedure, then I will not be able to compare different models, since my calibration samples will vary from one data set to another, because spectral data are not the same for different accessories. So, I was thinking is it a good idea to perform similar procedure, but on all Y values of interest, since I have them for all 50 samples? In this way I will have exactly the same calibration sample set for different x-data. |