| Author | Message | |||
KongFanli (kongfanli) Junior Member Username: kongfanli Post Number: 7 Registered: 10-2011 |
Dear Karl and Tony Hi��i am coming,i have never left the Forum,i celebrated Spring Festival a few days earlier, and Sorry for my late response. Thanks again for helping me do you need the diagnostic detail as the spectra ,Noise Wavelength and bandwidth? And if yes I will send to Tony when I in my office. the first problem we met occasional, the second periodically appeared for some time, but the two problems have occurred in our different instruments many times Yours Kong | |||
Karl Norris (knnirs) Senior Member Username: knnirs Post Number: 72 Registered: 8-2009 |
To Kong Fanli, I have posted the two images I obtained by your first and second post. Are these correct, and can you give more detail as to how these were collected? Karl | |||
Karl Norris (knnirs) Senior Member Username: knnirs Post Number: 71 Registered: 8-2009 |
Hi Pierre, it appears that worked, so I will attach the second image. Karl 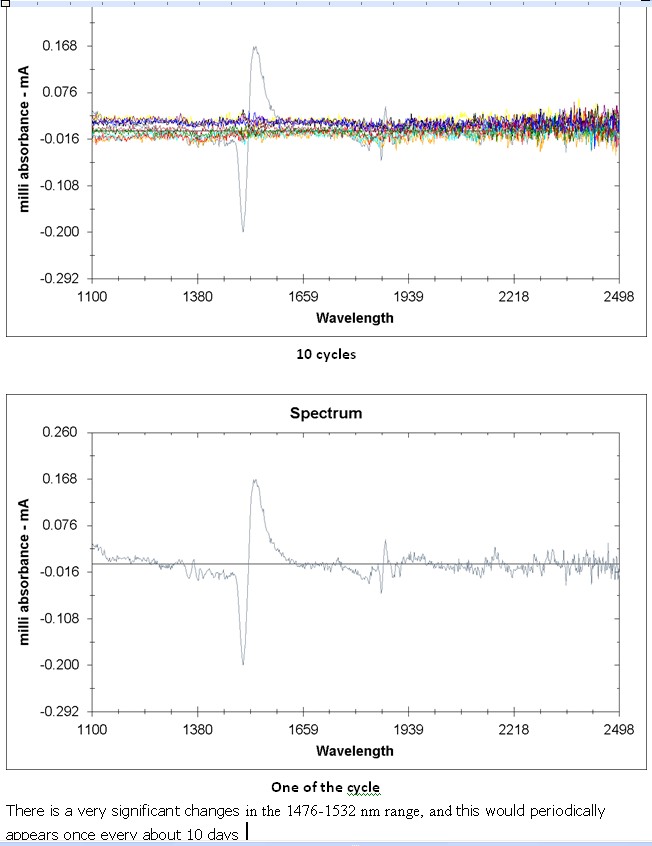 | |||
Karl Norris (knnirs) Senior Member Username: knnirs Post Number: 70 Registered: 8-2009 |
Hi Pierre, It appears you asked me to post these spectra in the forum, so I will try. 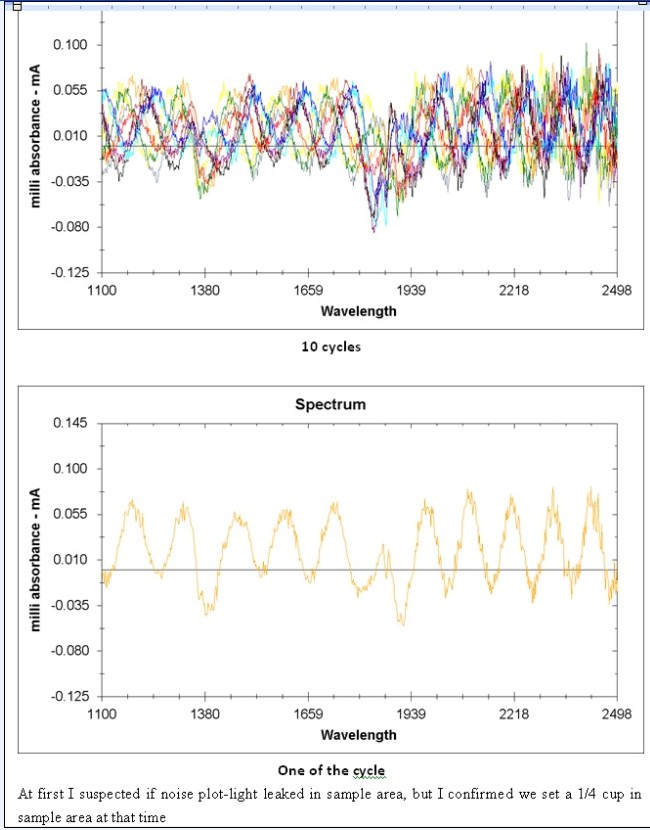 | |||
Tony Davies (td) Moderator Username: td Post Number: 294 Registered: 1-2001 |
Dear KongFanli, I hope you are still connected with the Forum. This message is about your question dated 6/December/2011. Karl Norris would like to do further analysis of your diagnostic spectra. For this he needs the original data files from the spectrometer. Would you like to send them to me at [email protected]? Best wishes, Tony | |||
Pierre Dardenne (dardenne) Senior Member Username: dardenne Post Number: 77 Registered: 3-2002 |
Hi Karl, Could you please upload these 2 images with spectra? best wishes, Pierre | |||
JIAN LI (fosschinajackie) New member Username: fosschinajackie Post Number: 2 Registered: 2-2013 |
Almost a year... But it is still helpful... There are lots of NIR using in CHINA,many of them may need some help,but only a few of them know this Forum. Maybe let more NIR users in CHINA know this Forum is good for both sides. | |||
Karl Norris (knnirs) Senior Member Username: knnirs Post Number: 69 Registered: 8-2009 |
Hi All, The question raised here was never answered, and since I was last I wish to reopen the discussion. I had not previously looked at the spectra because of the confusion in transference, but I have now looked at them. I have two images, the first shows noise spectra with 11 fairly uniform peaks, but shifted on the wavelength scale. there is a distortion in the 1850 nm region, and I suggest this results from the change in filters at this wavelength. I cannot explain the apparent bands. The second image shows 9 matching normal noise spectra with one spectrum showing the distortion in the 1850 nm region, along with a distortion in the 1500 nm region. I suggest this distortion is from the Wood's anomally in the grating. This occurs in this region for the grating used in this instrument, and the spectral distortion occurs when the wavelength scale is unstable. So this suggests to me that the instrument needs repair. I am sorry I did not report this sooner, but I lost track of this discussion, until it was opened recently without any comments. | |||
Karl Norris (knnirs) Senior Member Username: knnirs Post Number: 62 Registered: 8-2009 |
Hello, Somehow I missed this discussion, but since Dave Hopkins mentioned my name I should respond. I have discussed the subject of noise pulses in NIRSystems instruments, but I don't think they were in the 1500 nm region. Ken VonBargen of NIRSystems has referred in the past to a noise pulse in the 1500 nm region related to the Wood's anomaly in the gratings. However, the noise was on every spectrum, so this doesn't match. Karl | |||
Guido Bombi (guido) New member Username: guido Post Number: 2 Registered: 1-2008 |
Dear David, then NIRSystems 6500 is equipped with a device which moves the sample cell up and down in order to obtain a mean spectrum for unhomogeneous samples; the lower part of the sample cell holder contains the reference. However, when the sample cell holder is in its uppermost position a tiny slit remains uncovered. During normal operations this tiny slit is covered by the inferior part of the sample cell and during the routine diagnostics is better to put an empty cell in order to prevent light leakage to the detectors. About the large effect observed in the visible range I guess that the fluorescent tube emits mostly in that region: here's the emission spectrum of an halophosphate fluorescent lamp (from Wikipedia, http://en.wikipedia.org/wiki/Fluorescent_lamp) 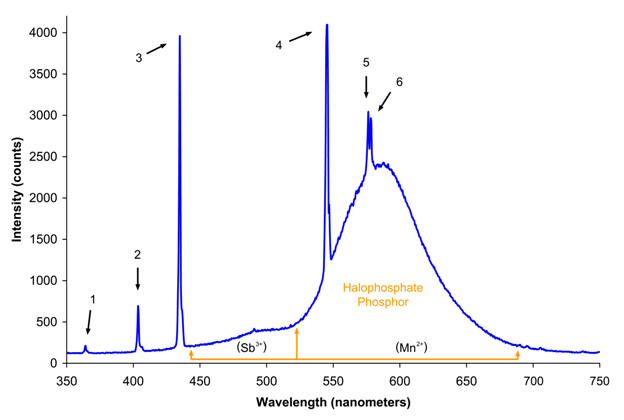 the sharp lines being emmission lines of mercury. P.S.: the problem arised during the cheks after the transfer of the instrument from another place and the solution has been to remove the lamp... | |||
venkatarman (venkynir) Senior Member Username: venkynir Post Number: 144 Registered: 3-2004 |
Hi David; It may due to switching of detecting device and spinning selection of grating .Here I donot see any ligh lekage. It is look like noise spectra | |||
David W. Hopkins (dhopkins) Senior Member Username: dhopkins Post Number: 210 Registered: 10-2002 |
Hi Guido, First, welcome to the discussion group. Second, thanks very much for sharing your observations. The effect you show is very dramatic. I was impressed by the huge magnitude of the effect at the 400 nm end of the spectrum. It occurs to me that this effect could be happening whenever there is a small light leakage from fluorescence lighting, and the periodic appearance might be lost, but the effect would be to increase the photometric noise at the short wavelength region. It makes me wonder whether it would be best to operate the instrument under weak incandescent lighting? Back in the days when I did my thesis work, we used to operate our UV-vis spectrometer in a darkened room. It was partly to avoid exposing our samples to visible light, to avoid photobleaching effects. It was also to minimize stray light, to obtain the best possible spectra. Thanks, again! Best regards, Dave | |||
Guido Bombi (guido) New member Username: guido Post Number: 1 Registered: 1-2008 |
Dear KongFanli, the first spectrum seems very much the sinusoidal signal from a fluorescent tube: I guess that the intensity variation in the time domain is registered in the wavelength domain due to the spinning of the monochromator; obviously enough, detector's noise is added too. Something very similar happened to us when our FOSS NIRSystems 6500 was put directly under a ceiling fluorescent lamp: here it is 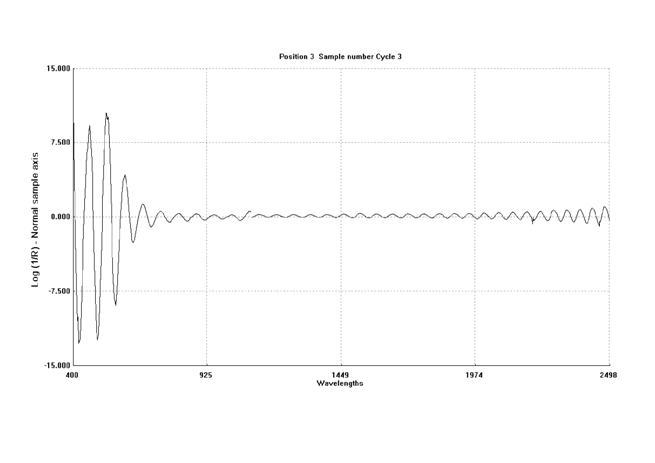 In my example is possible to count approx. 35 cycles in a 2100 nm range which results in 60 nm/cycle; I see from your example than you have about 120 nm/cycle. Hope this can help you... | |||
Howard Mark (hlmark) Senior Member Username: hlmark Post Number: 464 Registered: 9-2001 |
Fernando - polystyrene has a very prominent and nearly isolated peak at approx. 1681 nm (the exact wavelength will vary depending on the measurement bandwidth). You can't miss it if the wavelength scale is even close to being correct; once you've identified it you can see if there's any appreciable wavelength error. If it measures within a couple of nm, I wouldn't worry about the residual error at this time. You may want to revisit the question after you've corrected any other problems, though. It will not help you with stray light or other problems, however. \o/ /_\ | |||
Fernando Morgado (fmorgado) Senior Member Username: fmorgado Post Number: 31 Registered: 12-2005 |
Hello : Will be important see other graph. Foss have wavelenght accuracy Test. In this Test a paddle with a reference ( poliestirene) is put in the light. Will be important know if this spectra is correct, if present the peak you mention, maybe some problems in the detector or order sorter ( grating movement control) Regards Fernando | |||
Jos� Ram�n Cuesta (jrcuesta) Intermediate Member Username: jrcuesta Post Number: 16 Registered: 11-2009 |
I saw the spectra and it seems to me that light is coming to the detectors from an external source. Cover the attachment (spinning or transport) with a black bag or turn off the laboratory light to see if the diagnostics pass. | |||
David W. Hopkins (dhopkins) Senior Member Username: dhopkins Post Number: 209 Registered: 10-2002 |
Hi KongFanli and Howard, I was able to open both downloads. I don't know why the files are downloaded to my computer with the '.unk' extension. I found that changing the extension to the listed 'rar' or 'doc' allowed the computer to open the files with the appropriate program. I will take a shot at explaining the spectra. First, I think you are observing interference fringes in an empty cuvette. When you measure the noise spectra, it is recommended to use no sample cells in the light path. Secondly, I think you are observing a feature at about 1520 nm that is caused by a filter that falls into place to remove stray light. I seem to remember that Karl Norris wrote an explanation of this artefact somewhere on this discussion group. However, I could not find his explanation by searching for 'Norris'. Karl, please help us! Best regards, Dave | |||
Ian Michael (admin) Board Administrator Username: admin Post Number: 34 Registered: 1-2006 |
Howard (and others), just rename the file after you have downloaded it with a .doc extension and it should open. I've had this problem before and thought it was solved. I still cannot see why it is not working: another reason the forum needs to be upgraded! | |||
Howard Mark (hlmark) Senior Member Username: hlmark Post Number: 463 Registered: 9-2001 |
I'm not sure I understand what's going on, but the message says the file is diagnosticsdiprintscreen.doc but when I click on the file I get the message that the file to be opened is the_diagnosticsdiprintscreen-13062.unk \o/ /_\ | |||
KongFanli (kongfanli) Junior Member Username: kongfanli Post Number: 6 Registered: 10-2011 |
Tony
| |||
Tony Davies (td) Moderator Username: td Post Number: 273 Registered: 1-2001 |
Dear Kong Fanli, Would you like to try posting an uncompressed file? Best wishes, Tony | |||
KongFanli (kongfanli) New member Username: kongfanli Post Number: 5 Registered: 10-2011 |
Dear all i am using the FOSS Systems 5000,there are two strange spectrum when we diagnosed the instrument.see the details in the attchment.Im obliged to you for your help. yours Kong Fanli
|